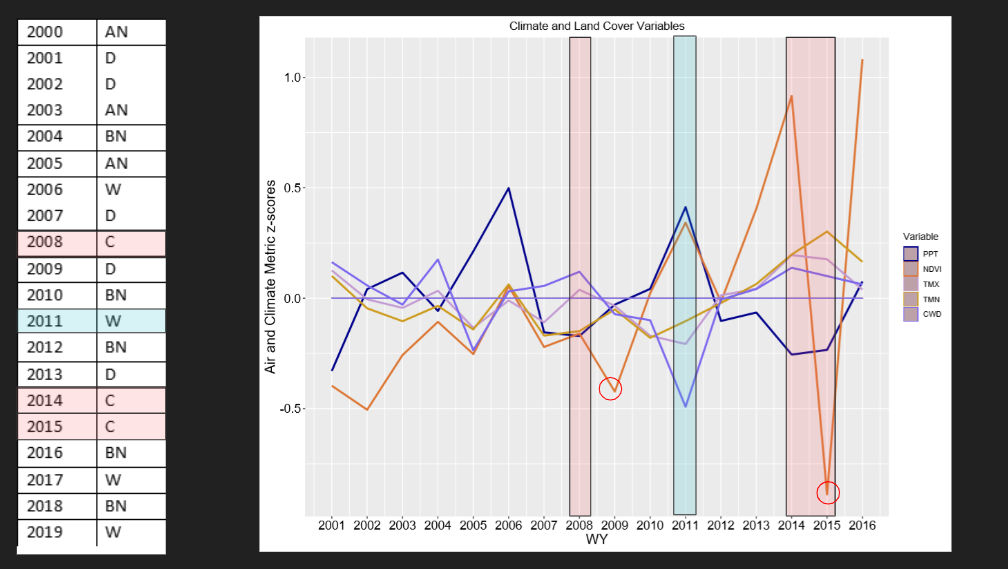
Last week, Jeff, SSI’s ecologist and Wes, one of SSI’s AmeriCorps members, presented their work modeling water quality and climate change data at the California Water Boards Water Data Science Symposium. Using R, a programming language, they overlaid SSI’s twenty years of monthly water quality measurements along Deer Creek with climate and land use data. This model is a first step towards examining the response of water quality and benthic macroinvertebrate communities to climate change and land use over time, a project which will help SSI define management strategies it can focus on in the future to increase climate resilience.
Models are, by definition, imperfect representations of reality. However, they can still give us some idea of underlying patterns, especially in a long-term dataset like our Deer Creek data. The model used for this project showed, among other things, that changes in biological communities were more associated with changes in water temperature than any other variable in the model. NDVI measurements (a vegetation index) also fluctuated alongside climate, spiking during extreme wet years and dropping the year after extreme dry years.
While analyses like this one can be hard to understand at first, they have practical consequences for programs like SSI’s. For one, they can show us where to prioritize restoration projects. For example, this model showed that three downstream sites experienced high nitrate and phosphate levels in dry years–future restoration projects could focus on limiting this nutrient loading. We also learned that we can’t just assume that elevation and location predict climate resilience; higher elevation, forested sites like Site 1 don’t always show less variability in climate metrics such as temperature and precipitation than downstream sites. Finally, using certain analysis techniques can be a useful way to fine-tune monitoring programs, or even make programs more financially accessible, by identifying which variables co-vary, and which respond the most to stressors like climate change. For instance, we now know that if we had to start a monitoring program on Deer Creek from scratch, we could still collect meaningful data to assess climate resilience even if we only had a thermometer and a computer, because water temperature is so significant in our model. (Of course, more types of data than just temperature are needed to measure other important stream health indicators — hence our comprehensive water quality lab!)
Over the next few months our science team will keep refining this model, adding more land use data and stream measurements. We hope this project will continue to inform our water quality monitoring and restoration programs, as well as the work of our partners, in the future!
Click to enlarge image