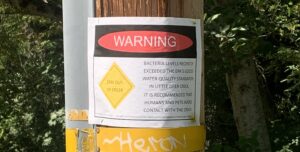
UPDATE – E. coli at Pioneer Park
As we transition from the end of the summer heat into cooler temps and some early season rain, Sierr...
As all readers will surely be aware, California has been experiencing increasing fire severity and frequency in recent years. In 2020, 4 million acres were burned, and in 2021, the Dixie and Caldor fires were the first fires in CA history to hop the crest of the Sierra Nevada. So, to address this topic of increasing importance and unknown consequence, in the 2020 and 2021 fire seasons Sierra Streams Institute partnered with South Yuba River Citizens League (SYRCL) and the Central Valley Water Board to investigate the impacts that fire may have on our local watersheds.
Specifically, this collaboration focused on monitoring storm events subsequent to the fire seasons of 2020 and 2021. If you’d like to learn more about the importance of stormwater monitoring in the Sierra Nevada, you can read our previous blog post on that topic here.
We’ll start by introducing three recent fires in the Bear, Yuba, and Feather River watersheds, and then take a closer look at the water quality data we gathered in the months subsequent to each of them.
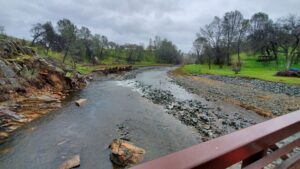
River Fire
Sierra Streams Institute had been monitoring sites in this area until about 2016, and so we restarted sampling at 2 of our previous sites, one just above the burn scar and one below. It was helpful to have this “pre-fire” data, but we weren’t monitoring during storms back in 2016, so what we can infer from that previous data is still a little limited.
You’ll notice later that all of the River Fire graphs include data from back in 2016 when we used to sample there, so after the fire we started sampling at these sites again on October 1, 2021 during four of the storms that blew in that month.
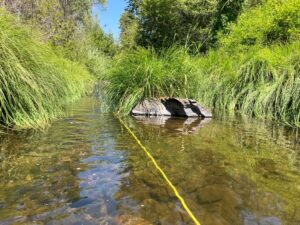
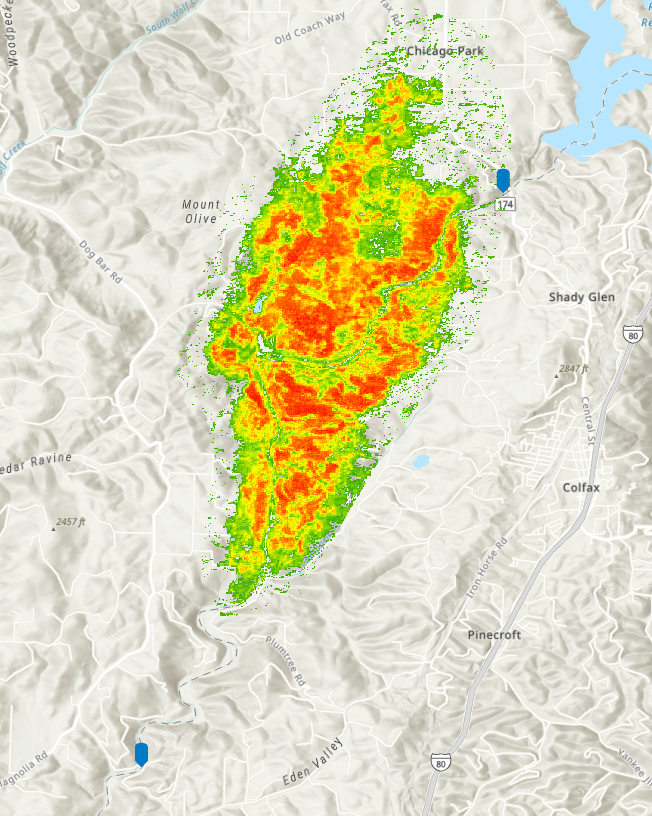
Jones Fire
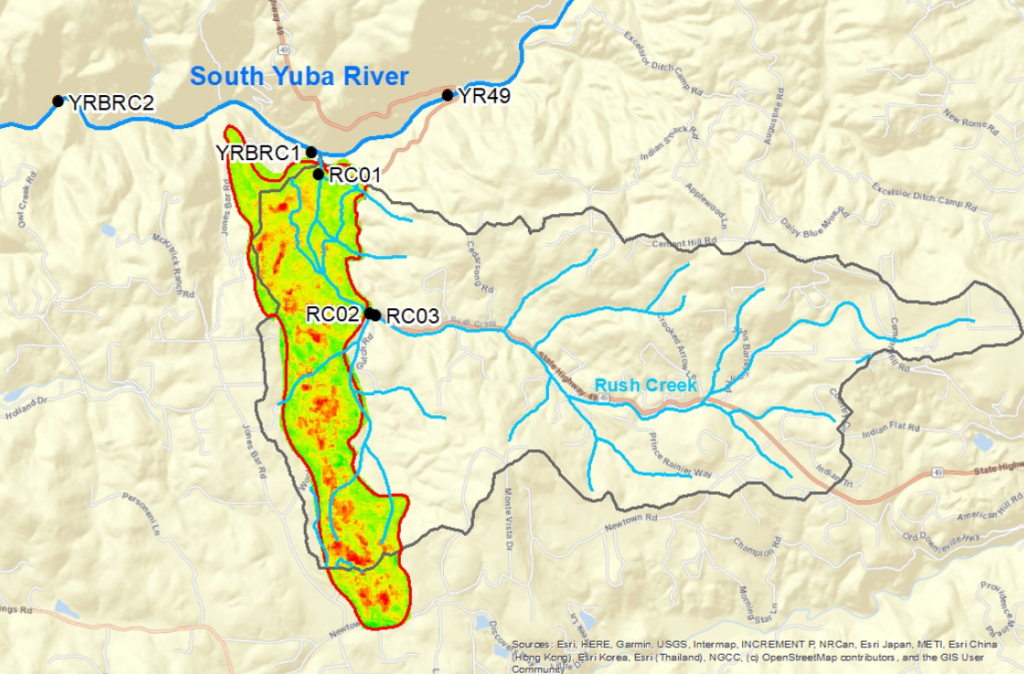
SYRCL monitored from September 2020 through September 2021, a total of 6 sites and 7 storms. The Rush Creek sites represent different drainages within the Rush Creek subwatershed. One site on the South Yuba served as the upstream control, and the other two Yuba sites were sampled to see how potential pollutants from Rush Creek and the burn scar would dissipate in the South Yuba.
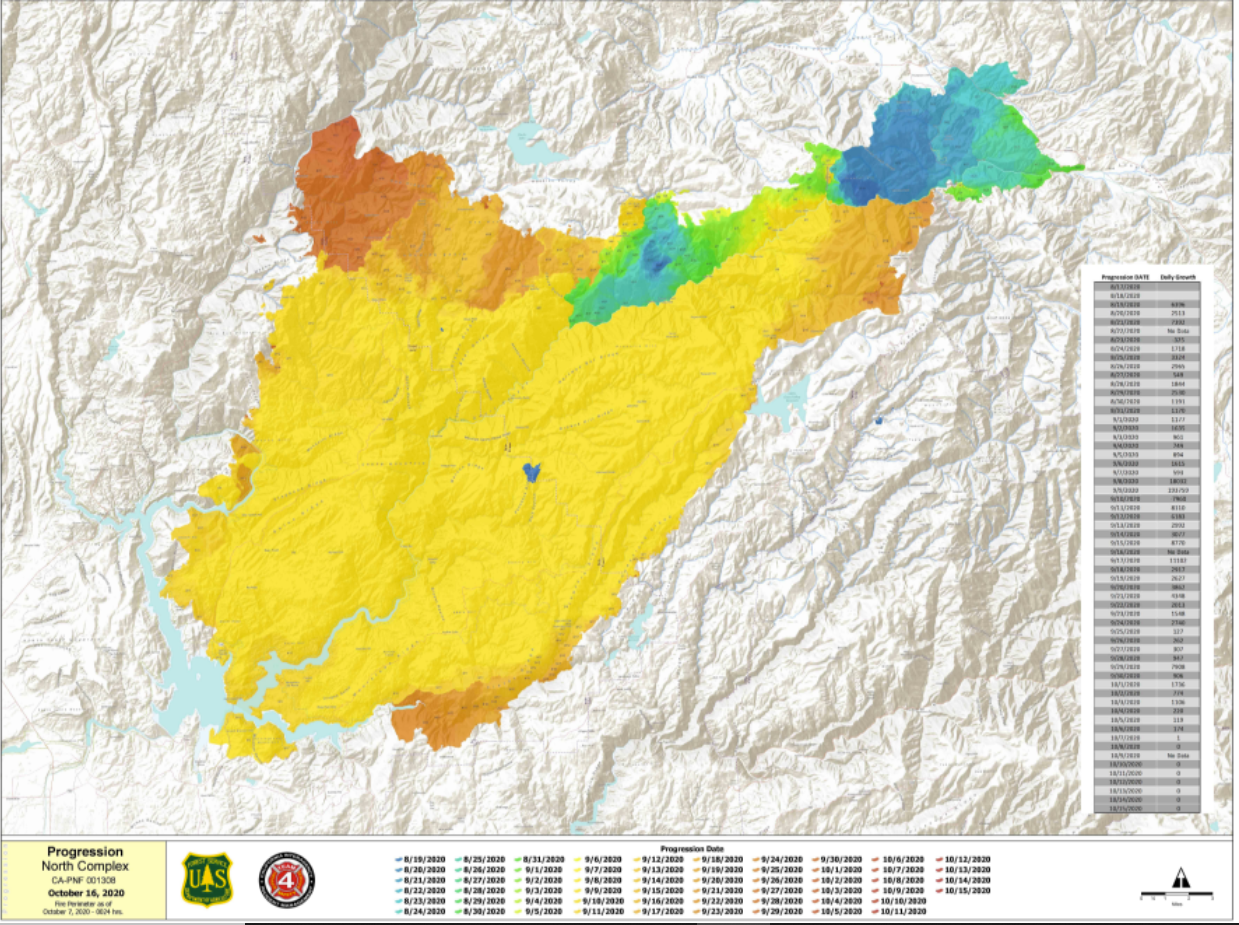
North Complex Fire

The Central Valley Water Board monitored 6 sites during 6 rain events from Nov 2020 to April 2021. Their sites were in different subwatersheds within the burn scar with one site downstream of Lake Oroville.
One thing you may notice is that each organization monitored different water quality parameters. Despite some amount of overlap, these categorical differences made data analysis difficult. Naturally, one main takeaway from these investigations is the need for standardized monitoring methods in order to produce more comparable data.
Based on prior meta-analyses of post-fire water quality data performed by Rust et al. in 2018 and 2019, we would expect to see a post-fire flush in nitrate, phosphate, and iron, along with an increase in nutrients and metals as fire severity increases. The longevity of these substances in the water would also be expected to change in response to water flow.
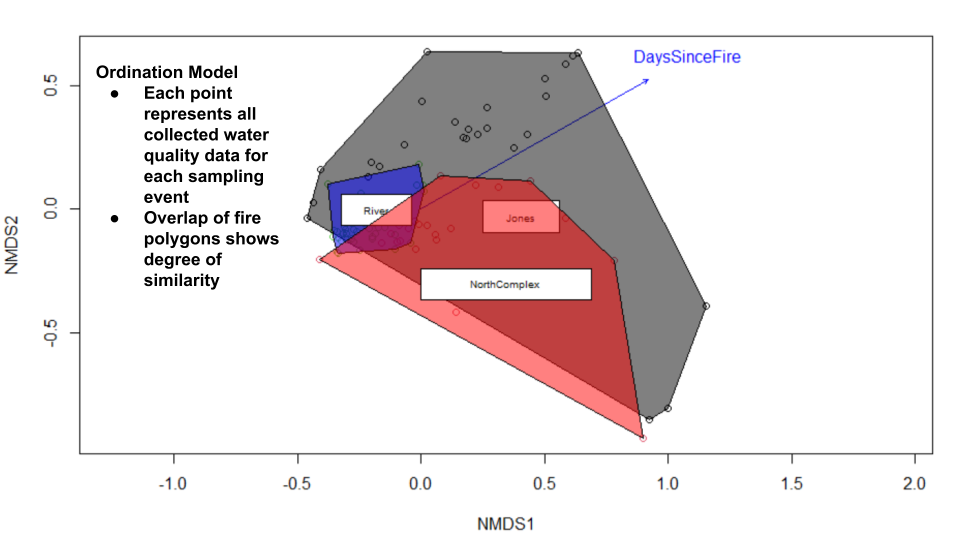
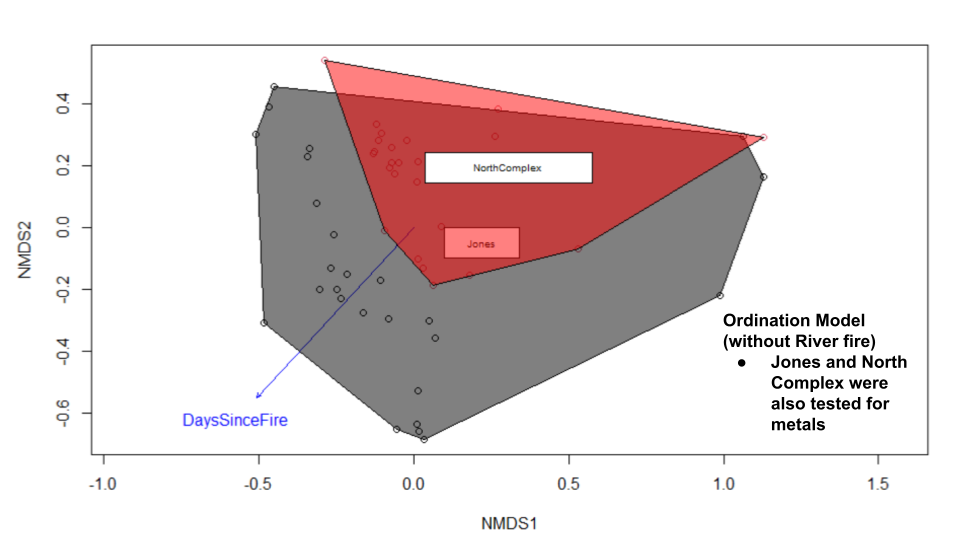
The following two plots are an amalgamation of all the water quality data we gathered for each fire. The drawn polygons roughly depict the variability of the data as a factor of area, i.e. increased area equals increased variability, and the overlap of each fire polygon shows the numerical similarity between them. The arrows labeled “DaysSinceFire” indicate the direction in which time is progressing in relation to the data – notice this arrow points in different directions on each plot.
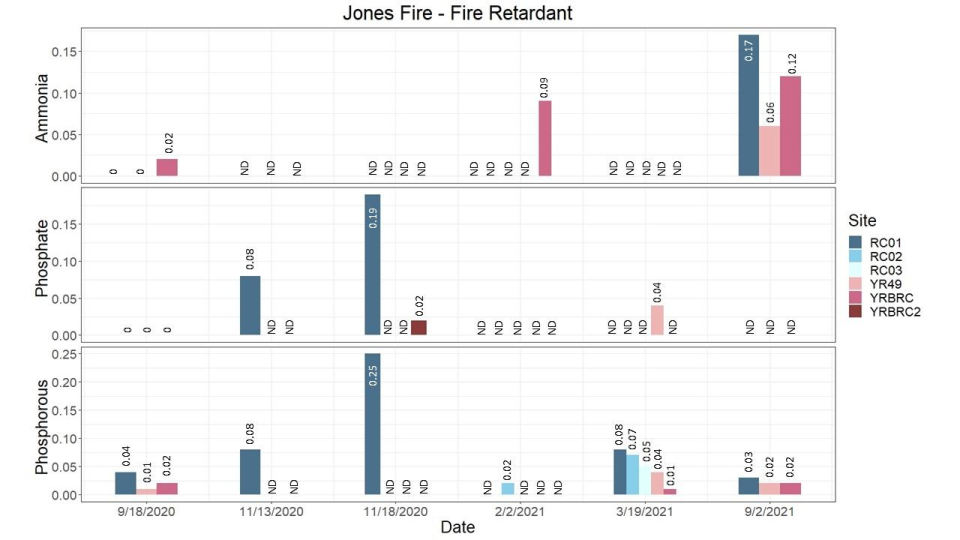
Laboratory analysis of water samples for ammonia, phosphate, and total phosphorus revealed that the sampled storm events did not cause a significant continuous influx of these compounds into Rush Creek and the South Yuba River. Although there were spikes of phosphate and phosphorus at one of the Rush Creek sites during the storm of Nov. 18, 2020 as well as elevated ammonia in the final baseline sampling, these levels were all below established Numerical Action Levels, so the presence of fire retardant in the watershed did not appear to have a continuous quantifiable impact on water quality during the sampling events.
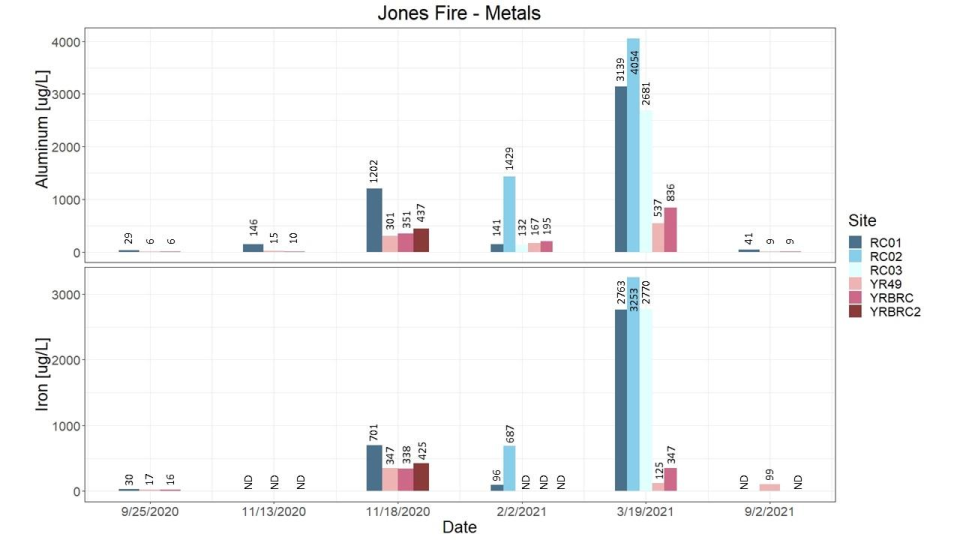
Our metals analysis revealed aluminum and iron were elevated in the Rush Creek watershed during storm events, yet it is not possible to directly link these elevated levels to the Jones Fire due to the lack of pre-fire storm sampling.
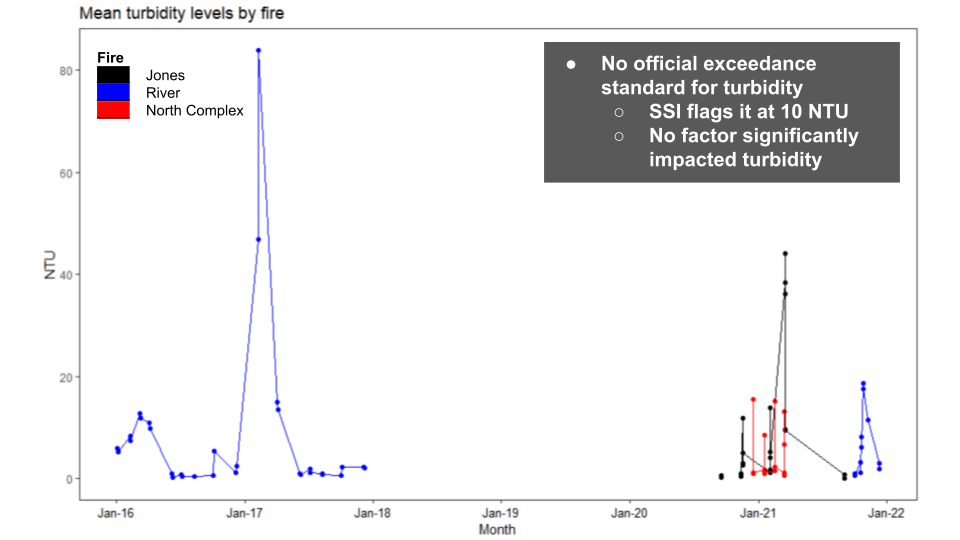
After reading our previous blog post on stormwater monitoring, one might expect to see a change in stormwater turbidity as a result of fire. However, our findings showed that no factor significantly impacted turbidity or even had a relationship with turbidity!
Overall, our results indicated that fire severity and fire size are not necessarily strong predictors of water quality, yet our lack of conclusive, statistical power here only emphasizes the need for more data, more cross-regional data-sharing, and the value of long-term, continuous monitoring.
This post is based on a presentation by Alex Cisneros-Carey and Helen Fitanides for the CA Water Quality Monitoring Council in 2022.