As we reach the first anniversary of the Jones Fire, there is a lot to reflect on both the landscape and organization. Much like a forest is renewed by low severity while simultaneously being forever changed by high severity fire, by losing our office to the blaze, we were given the opportunity to reevaluate our goals as an organization, start some new and much-needed research projects, and envision a new and uncharted future. We are looking forward to a bright future as we continue to grow as an organization to meet the ever-changing needs of our local community. At the same time, we would be remiss not to harness this unique opportunity to study a natural and integral component of Sierra Nevada ecosystems in our backyard. So, one year later, here is what we learned from the Jones Fire and how to integrate that knowledge into future forest management in the region. Climate change plays a key role in wildfire ignition and behavior in our region. Under a modified hydrologic regime with decreasing snowpack, increasing rainfall, and overall decreased soil water availability, wildfires are much more likely to start and spread quicker. Forest structure also plays an important role. Our analysis shows that forests that are both dense and have continuous fuel loads are much more likely to burn at a high severity.
The Jones Fire started with a lightning strike on August 17th, 2020, and reached 100% containment on August 28th, 2020. It burned 705 acres, starting in the lower Rush Creek drainage and burning up-canyon to the South toward Nevada City and Southwest toward Jones Bar Road. This fire resulted in 7 injuries, 21 destroyed structures, and 3 damaged structures. It also resulted in significant evacuations and palpable fear and worry from the community members between the Yuba River and Nevada City. When all was said and done, multiple homes, offices, and outbuildings were lost.
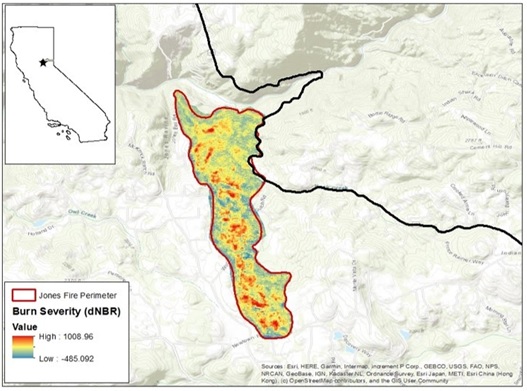
However, this fire was consistent with our historical fire regime in the region. It contained mixed severities, mostly low-severity burning and a few high-severity “runs” up the canyon walls (Figure 1). Fire severity can be assessed by measuring the electromagnetic light wavelengths, referred to as reflectance, which is utilized to infer the surface conditions. Specifically the reflectance data can be analyzed to distinguish between living and green vegetation, dead vegetation, and ground cover (soil, rock, etc.). By comparing imagery from before the fire to after, the “difference” in this reflectance ratio creates an estimate of burn severity. This scale runs from 0-2000, with negative values representing “regrowth” or errors in the data and high values representing high severity fire.
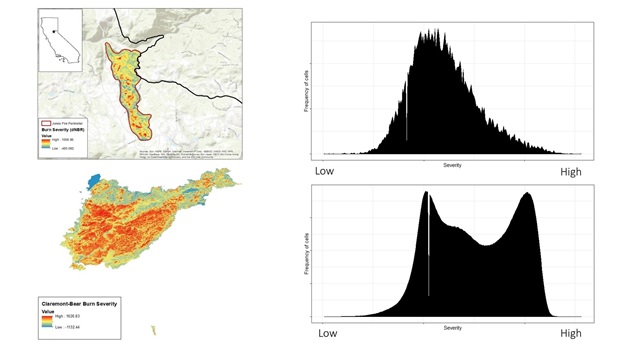
In the Jones Fire the amount of the fire scar that burned at a high severity was significantly lower than what was observed in the high severity megafires that occurred in the same year, such as the North Complex, such as the North Complex just to the north of us (Figure 2).The North Complex contained large swaths of what is often called “catastrophic” high-severity fire. Areas that burn at that severity do not usually recover to become the same kinds of forests they were. Instead, they represent what we call a “type conversion,” with a total loss of forest and regrowth of low shrubby (and often more flammable) vegetation. However, the Jones Fire, while containing “high-severity” areas, was a moderate-mixed severity fire.
So what do these terms mean? Burn severity refers to both loss of vegetation and canopy cover, but also soil scorching. When a fire burns hot enough to reach certain temperatures and severities, organic material in the soil is consumed, destroyed, or converted to a form that is less easily absorbed by plant roots. This change can result in long-term “moonscapes” and the “type conversion” referred to above. Mixed-severity fires like the Jones Fire, however, are essential to continued forest health in the Sierra. So, let’s take a walk down fire history lane.
The Sierra Nevada was forged in fire. According to our best estimates, the forests of the Range of Light used to burn every 2-20 years depending on vegetation type, based on data from sources such as tree ring burn scars and other “paleo” data sources. Historically, across California, ~4 million acres burned annually (interestingly, on par with the acreage burned in 2020, albeit not quite at the severities we experienced). Native habitation of the Sierra Nevada amplified this burn regime, with tribes often burning around community centers annually or every other year to clear grasses, encourage regrowth and stump-sprouting of culturally significant vegetation, and enhance food source availability. Many of the common pine species in our region depend on fire to clear gaps in the canopy, open cones and allow seedlings to sprout. Without fire, forests get choked with shade-tolerant species such as white fir, increasing fuel loads and amplifying burn severity when a fire hits. In short, most forest ecosystems of the Sierra Nevada need fire.
Fast-forward to the Gold Rush and post-Gold-Rush colonization. As Euro-American settlers continued to move into the foothill and upper Sierra forests and woodlands, fires were viewed as a threat. A “complete suppression” policy was soon to follow. Native Californians were forced to stop their cultural burning practices. When fires were spotted, land managers and firefighters quickly put them out. Without fire, the understory vegetation of the Sierra proliferated. Fast-forward again, and here we are with the highest densities of people ever living in the wildland-urban interface, ⎼the region between forested areas and built-up landscapes. This increased population (read: increased chances of ignition simply because there are more people here than before) coupled with high fuel load (from continued suppression of fires) is a recipe for destruction. The critical ingredient for a few years of unprecedented wildfire outbreaks? Climate change. The climate warms, aridity increases, fuel moistures decline, and fire seasons extend longer each year.
Now that we understand the background, what can the Jones Fire itself teach us? The science of fire ecology has made impressive strides in the last decade. A combination of new technologically advanced tools and increased understanding of wildfire as access to data from multiple wildfires with multiple severities continues to grow. Perhaps what is most striking from the field of fire ecology is the universal acknowledgment that fire severities are increasing. But what drives burn severity is highly nuanced. So, the answer to the question of what drives burn severity is often “it depends.”
The current common understanding in fire severity and forest structure is that “ladder fuel” (vegetation connecting the forest floor to the canopy) is a primary driver of burn severity and fire transmission. However, recent studies show evidence that forests’ structural variation (e.g., forest gaps and clumps) is associated with decreased fire severity and fire propagation across the landscape.
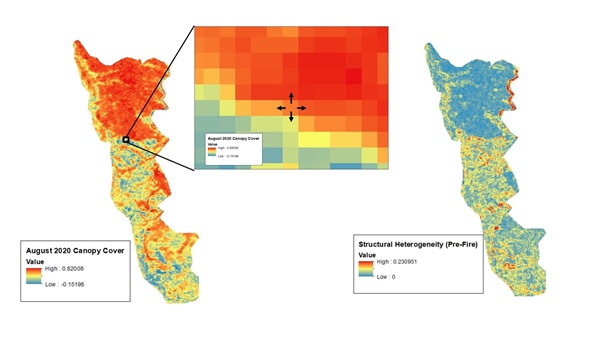
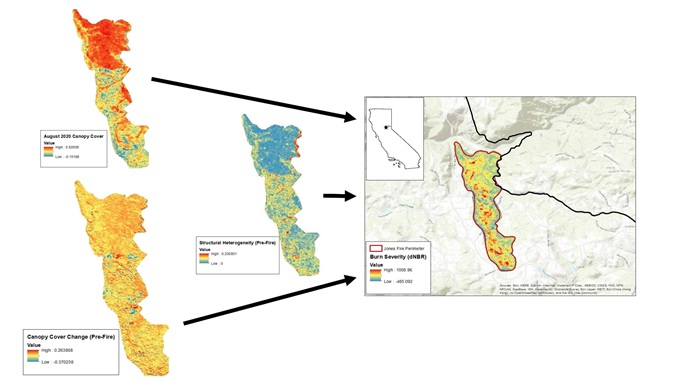
So, we at Sierra Streams Institute wanted to ask if the Jones Fire showed this same pattern. Did simple fuel load/forest density drive burn severity? Or forest structural variation? And could the same data sources we use to map density and structural variation also be used to map forest treatments before a fire and show if that treatment resulted in positive outcomes? To answer these questions, we used what is known as spectral imagery. We used publicly accessible data from the Copernicus/Sentinel-2 satellite from the European Space Agency gathered using Google Earth Engine (not to be confused with Google Earth!) to map vegetation cover. Using normalized difference vegetation index, or NDVI, change in NDVI before the fire as a proxy for forest treatment or change (Figure 3), and differences in NDVI between every individual point ( represented by a pixel) on the landscape to map forest heterogeneity, or structural variation, (Figure 4). We then asked which of these variables correlates most with resulting burn severity (Figure 5).
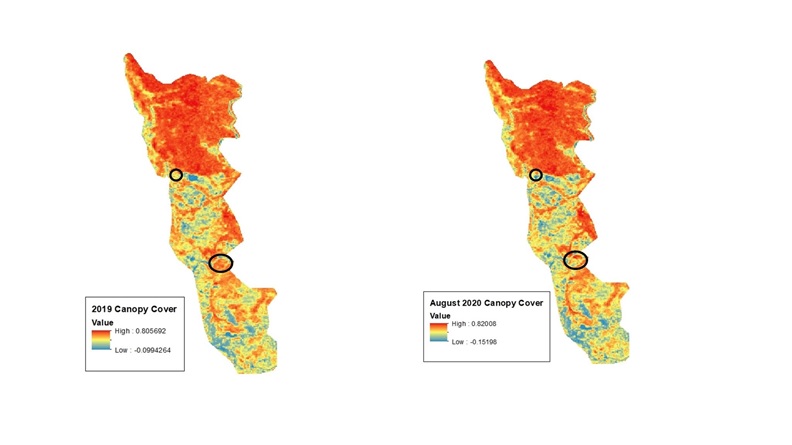
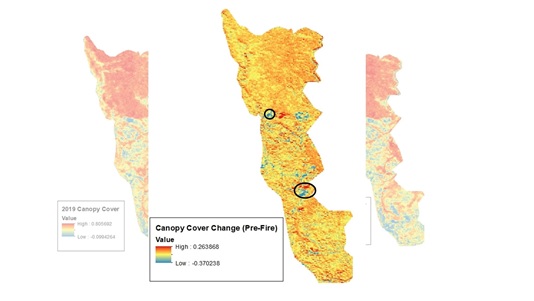
Figure 3. Change in canopy cover, gleaned from normalized difference vegetation index (NDVI) from Copernicus/Sentinel-2 imagery. Circles represent areas of significant change (blue = decrease, red = increase) in vegetation cover in the year before the Jones Fire. This kind of analysis can be used to identify treatments and their impacts on vegetative cover.
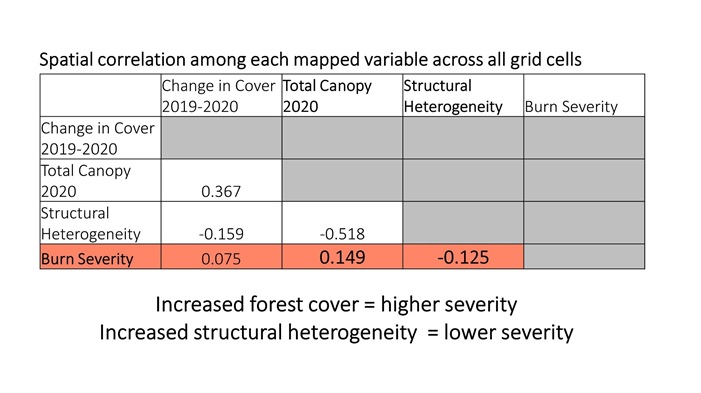
We found that NDVI and heterogeneity in NDVI across the landscape were the most significant determinants of burn severity (Figure 6). So what does this mean? It means that forests that are both dense (i.e., have high fuel loads) and have continuous (read: not “clumpy” or heterogeneous) fuel loads are most likely to burn at high severity and probably carry fire across the landscape.
So how do we incorporate this information into management? This study is just one small example of a good deal of research that is ongoing. We can continue to learn from the fires around us, but in the meantime, we can leverage these new tools and bits of evidence to be strategic with our fuel treatment placements. The standard approach is to build fuel breaks or treat “ladder fuels.” But the evidence is telling: structural variation is key to fire resilience and decreased burn severity. Instead of blanket treatments, we need to mimic fire and mimic what resists fire. We need to build in large gaps between clumps of vegetation and not be afraid to take out larger trees in favor of leaving clumps of untouched vegetation between those gaps. Think as fire thinks, and think as high-severity fire thinks; fuel breaks are great for operational (access for fire engine) purposes but will arguably do nothing for a high-severity “megafire.” But if we can decrease the severity and increase resilience, we return to viewing fire as a natural part of a landscape. Then when a fire hits, we can let it burn across the landscape to do its ecological job, not fearing for homes and loss of life.
None of this is to say this is the only answer. It is simply data and observations gleaned from a single fire in our area. Much more research needs to be done and can be done, using our surrounding fires as case studies. But as always, we must approach wildfire and how we prepare for fire with a sense of humility; we don’t know what treatment is best, and instead, we should ask fire to tell us what treatment is best.
Now that we’ve looked at the Jones Fire science, what about the personal side of it? We lost our office, so where are we now? Since our start in 1995 as a group of concerned citizens helping to monitor impacts of the reconstruction of the Pine Street Bridge on Deer Creek, we have dedicated our work to investigating the environmental issues that impact the health of our community and its ecosystems. And a lot has changed for our local community in that time. The pressures of climate change have impacted our water resources and our fire regime, new research has helped to deepen our understanding of the health impacts of living in Gold Country, and the groups that we work with have grown as changed as well. To help continue to adapt to meet this ever-changing environment, we are utilizing this transition as an organization to help refocus our goals and look to the organization’s future. Stay tuned for more updates as we continue this process.
It was devastating to lose our office. But we are excited to use this opportunity to study the impacts of forest structure on fire severity and help build Forest Management Plans that all community members can utilize as a blueprint to help manage their lands. Because the Jones Fire was a “mixed” severity fire, it did a lot to help many ecological processes in our landscape. These disturbance types help keep a diversity of habitats in our forests on which many animals depend. The creation of a Climate-Smart Forest Management Toolkit, funded by the Wildlife Conservation Board, will provide technical assistance, permitting information, and strategies for ensuring regional co-benefits of reduced wildfire, increasedclimate resilience, and improved wildlife habitat integrity for the Jones Bar Firewise community and surrounding areas, and we are excited to use what we learned from the Jones Fire to improve real-world applications
Ultimately the most important part of Sierra Streams Institute is you!
We are dedicated to connecting water, science, and people to benefit human and environmental health. As a community member, it is vital that you have an outlet to ask questions and look for answers that science can help to provide. And, as an organization, we depend on our community to help with the restoration, monitoring, and research we conduct. If you would like to get involved or help support Sierra Streams Institute, please follow the links below.
Well done, Jeff. Like trying to live under an umbrella for fear of rain, we need to accept that fire is part of our landscape as much as water and wind. We can welcome the knowledge of what we can do with it, or fear the eventuality when it comes.
Thank you for capturing the science and data that help us understand these fundamentals. In our need to understand better the science of our coexistence, and less that of control, this was certainly a great lesson.