Summer sampling by the numbers:
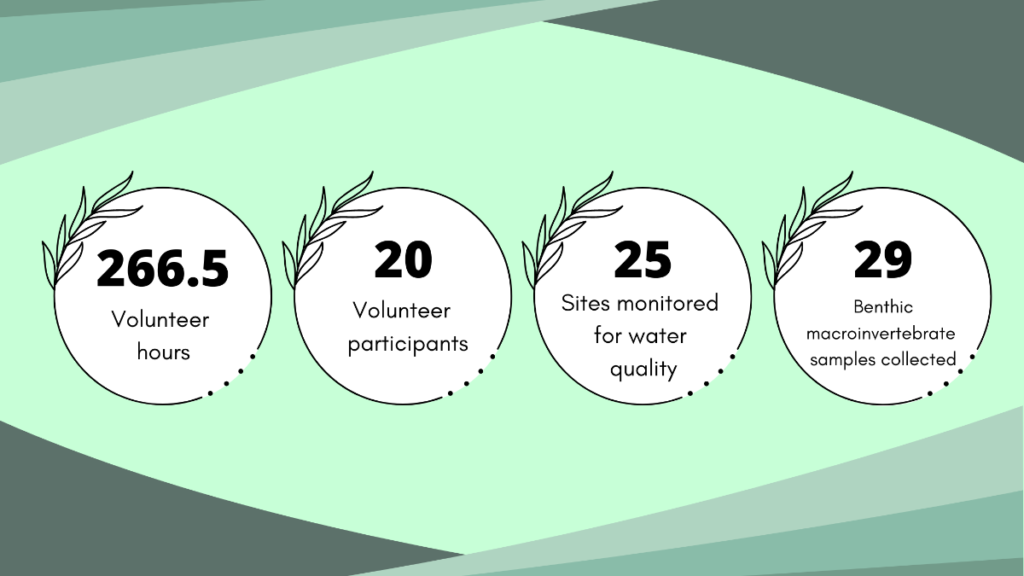
Summer Water Quality Summary:
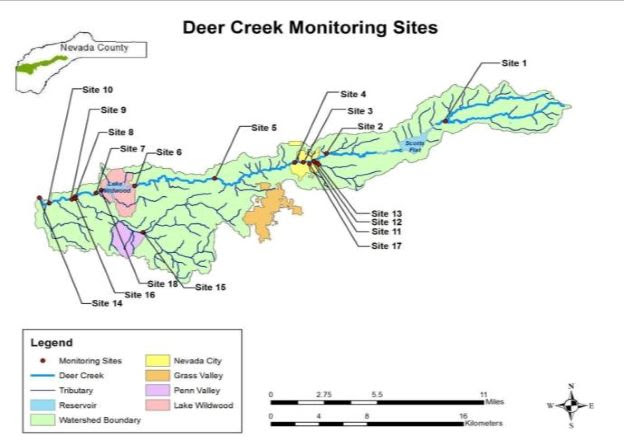
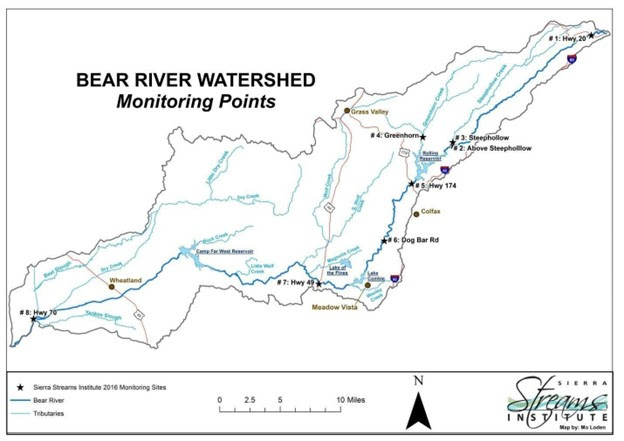
Between June and August, we collected water quality data from 12 sites in the Deer Creek watershed and 10 sites in the Bear River watershed. Learn more about our water quality parameters below!
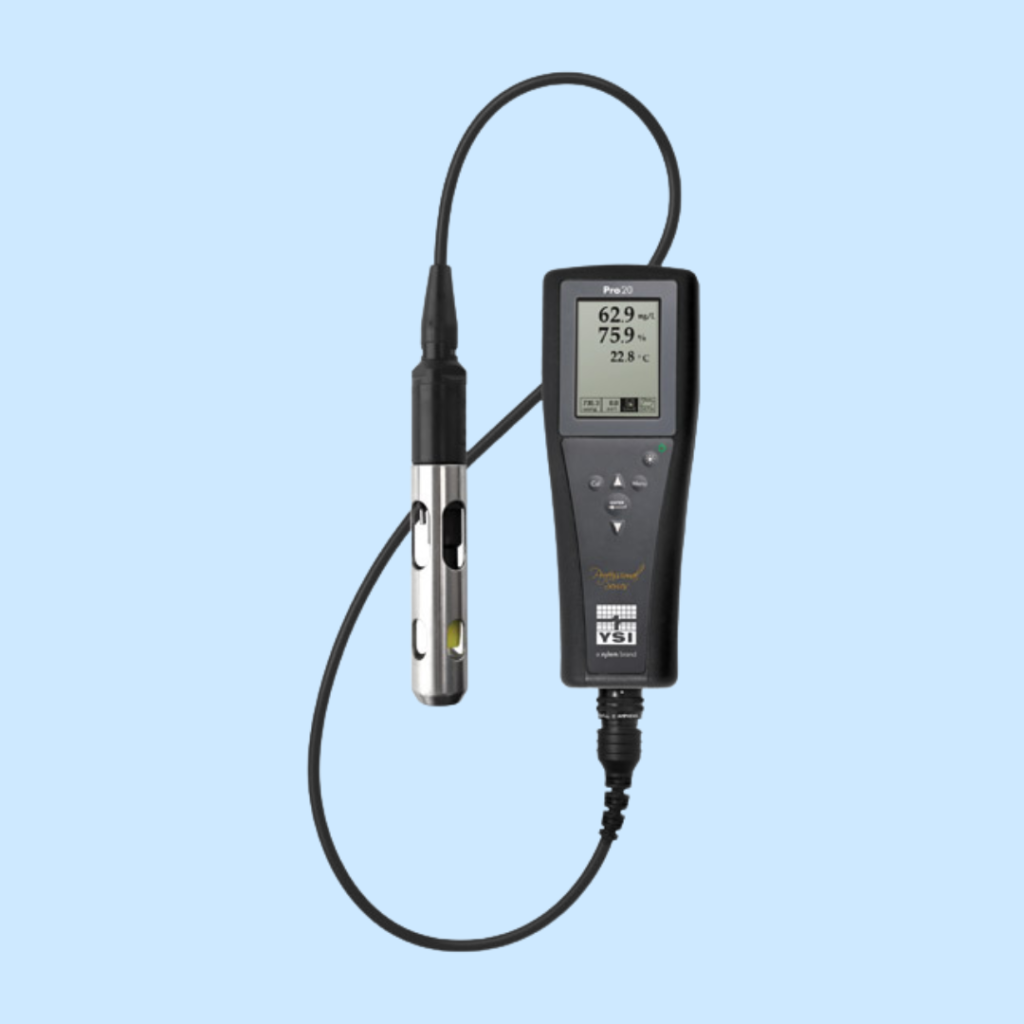
Oxygen is necessary for all forms of life. When dissolved oxygen levels in water drop below 5.0 mg/l, many aquatic organisms are put under stress. Dissolved oxygen is reduced when flows decrease, temperatures increase, or in response to excessive bacterial growth.
Three sites, Deer Creek 18, Bear River 8, and Bear River 13, recorded values below this threshold.
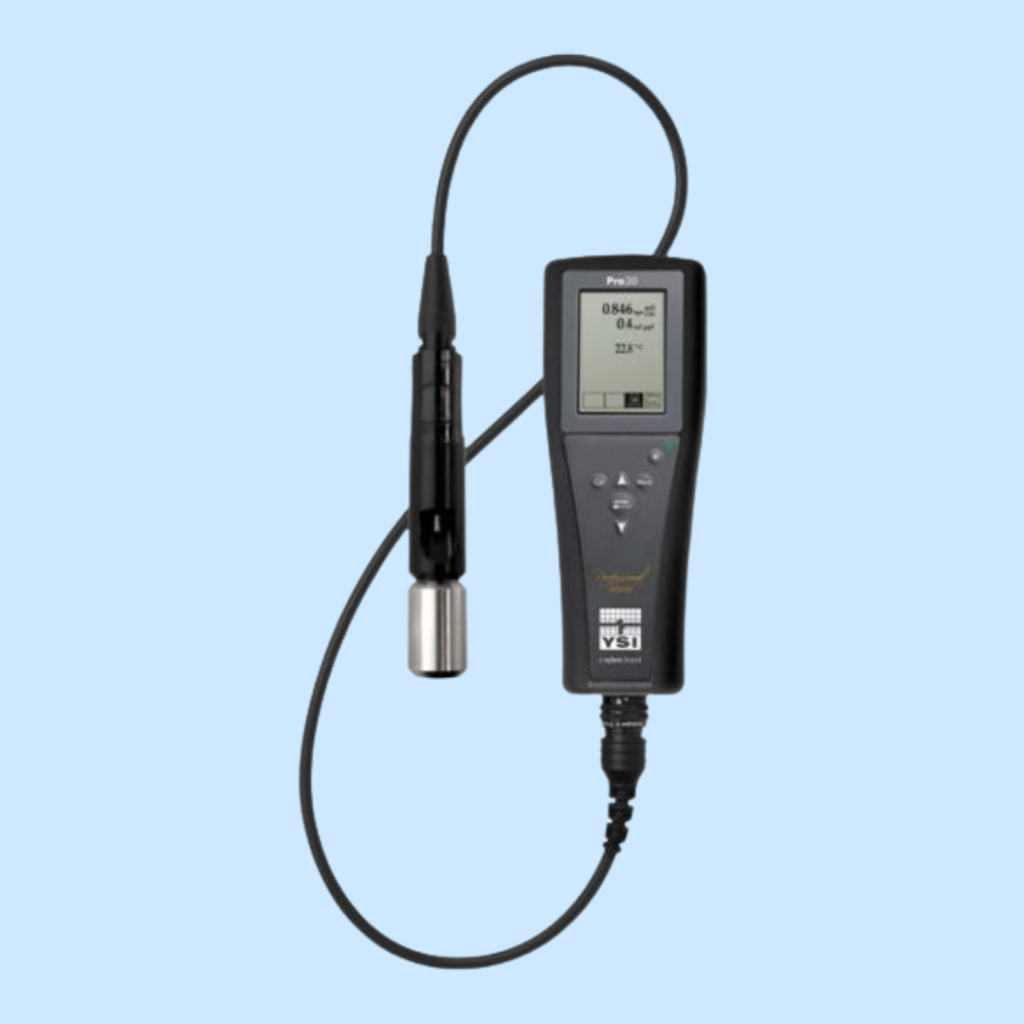
Conductivity measures the ability of water to conduct an electrical current. It provides an estimate of the dissolved, charged particles (like salts) in a body of water. An increase in conductivity beyond normal levels may indicate pollution from agricultural runoff or other sources. Generally, freshwater ecosystems have conductivity values below 500 μS/cm.
No sites recorded values above this threshold.
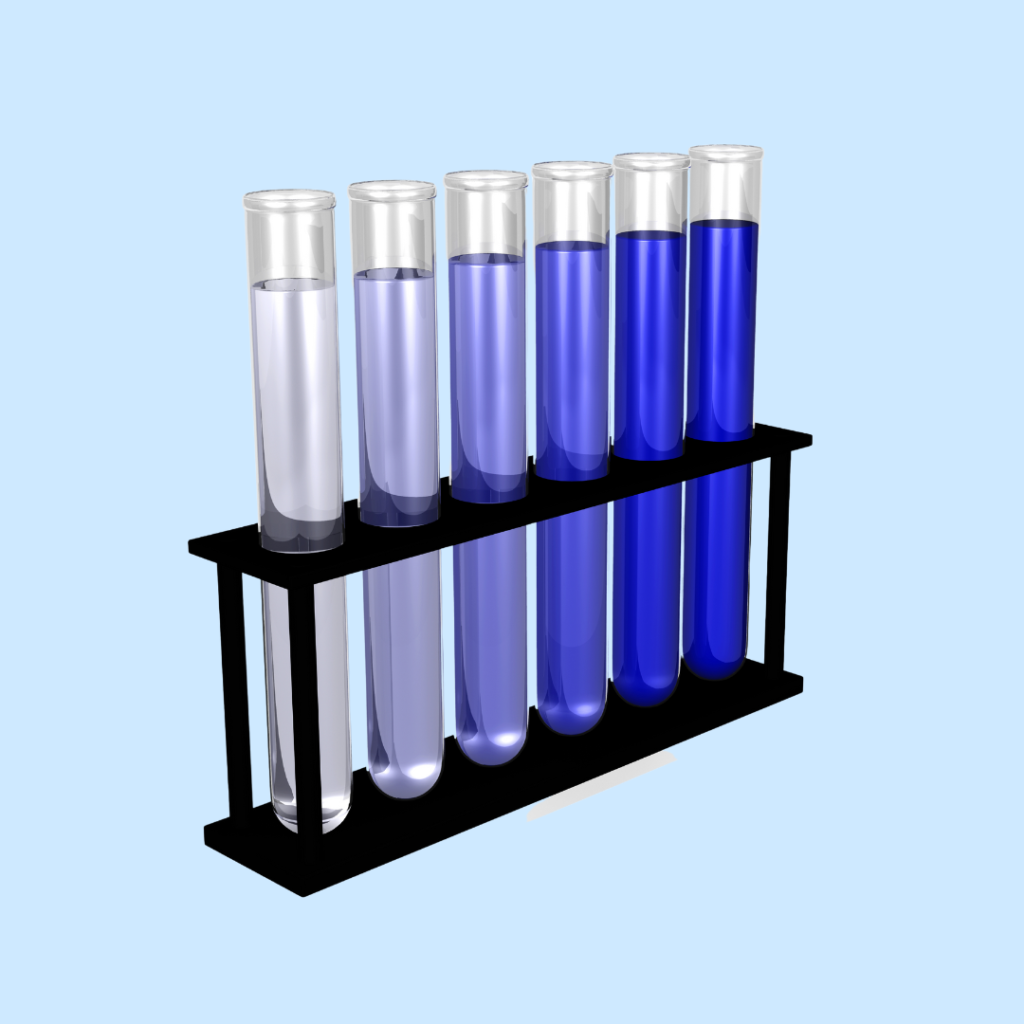
High concentrations of nutrients, including nitrate (NO3) and orthophosphate (PO4) can be an indication of runoff. Typical sources include wastewater plant discharge and agricultural runoff. Excessive nutrient input can stimulate planktonic and algal growth, leading to eutrophication. The EPA regulates nitrate levels above 10 mg/L.
No sites recorded values above this threshold.
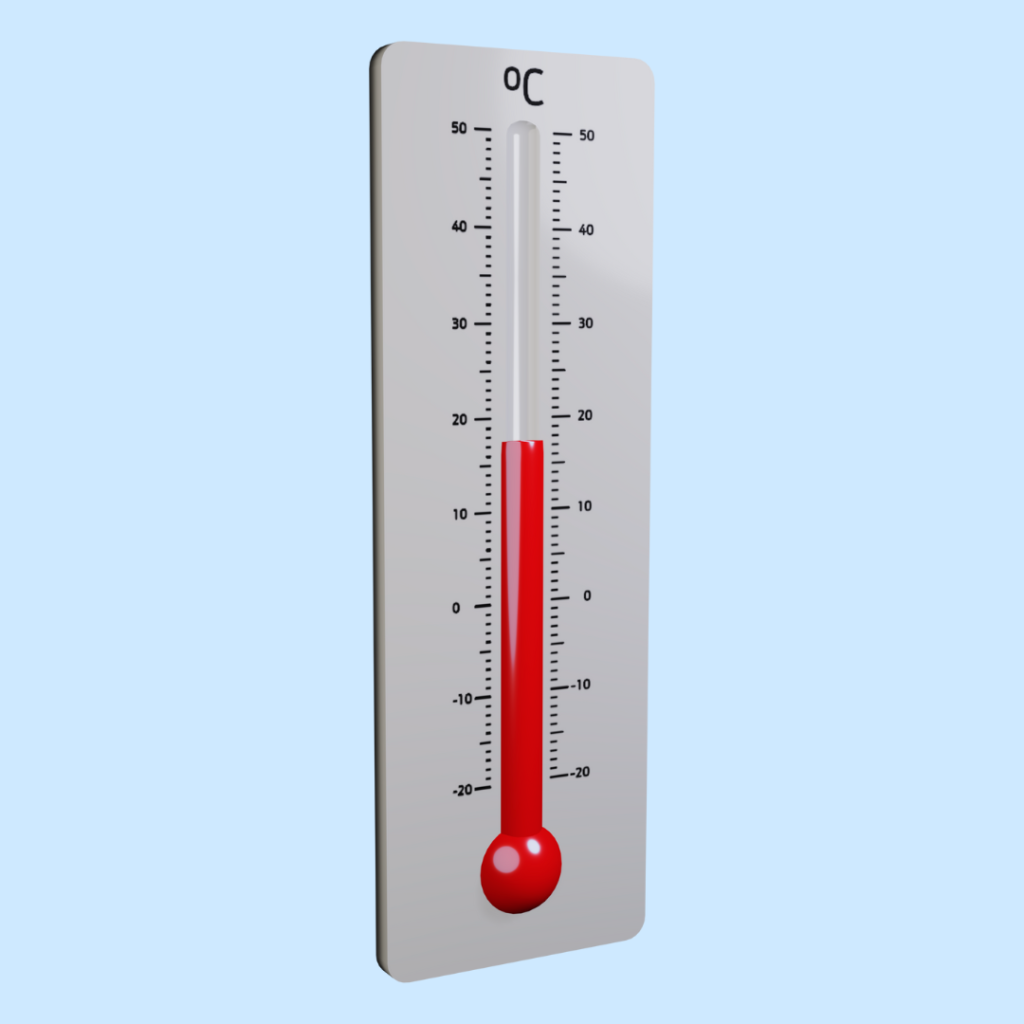
Water temperature can influence other water chemistry parameters such as dissolved oxygen levels, pH, rates of nutrient cycling, and contaminant transformation rates. Water temperature also regulates many aquatic organism functions including growth, reproduction, development, habitat preference, and competition. Water temperatures above 25℃ can be harmful for many aquatic organisms.
One site, Deer Creek 7, recorded temperatures above this threshold.
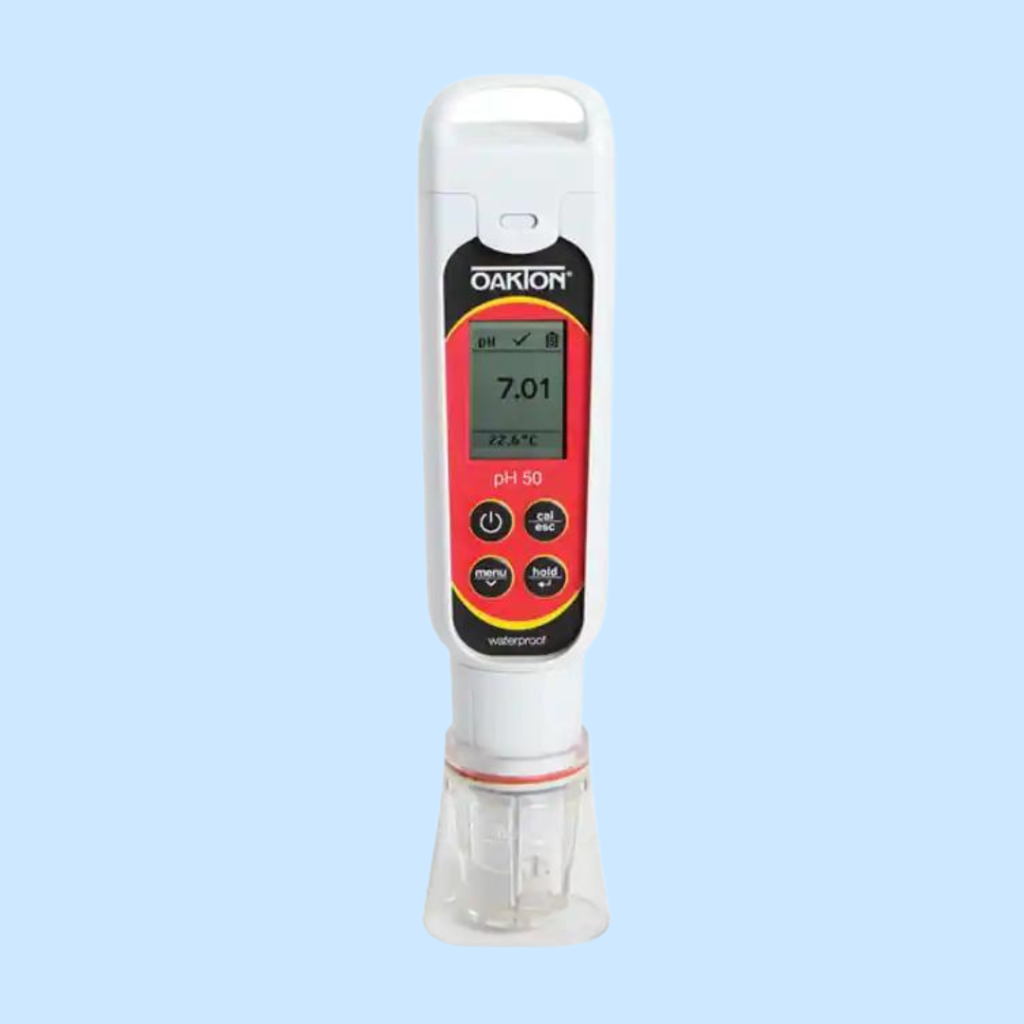
pH is a measure of hydrogen ion concentration and indicates the relative acidity or alkalinity of water. Many freshwater aquatic organisms are adapted to a specific pH threshold, between 6.5 and 8.5. pH measurements outside of this range may indicate problems such as excessive decay of organic matter (eutrophication) or acid mine drainage.
No sites recorded values outside of this range.
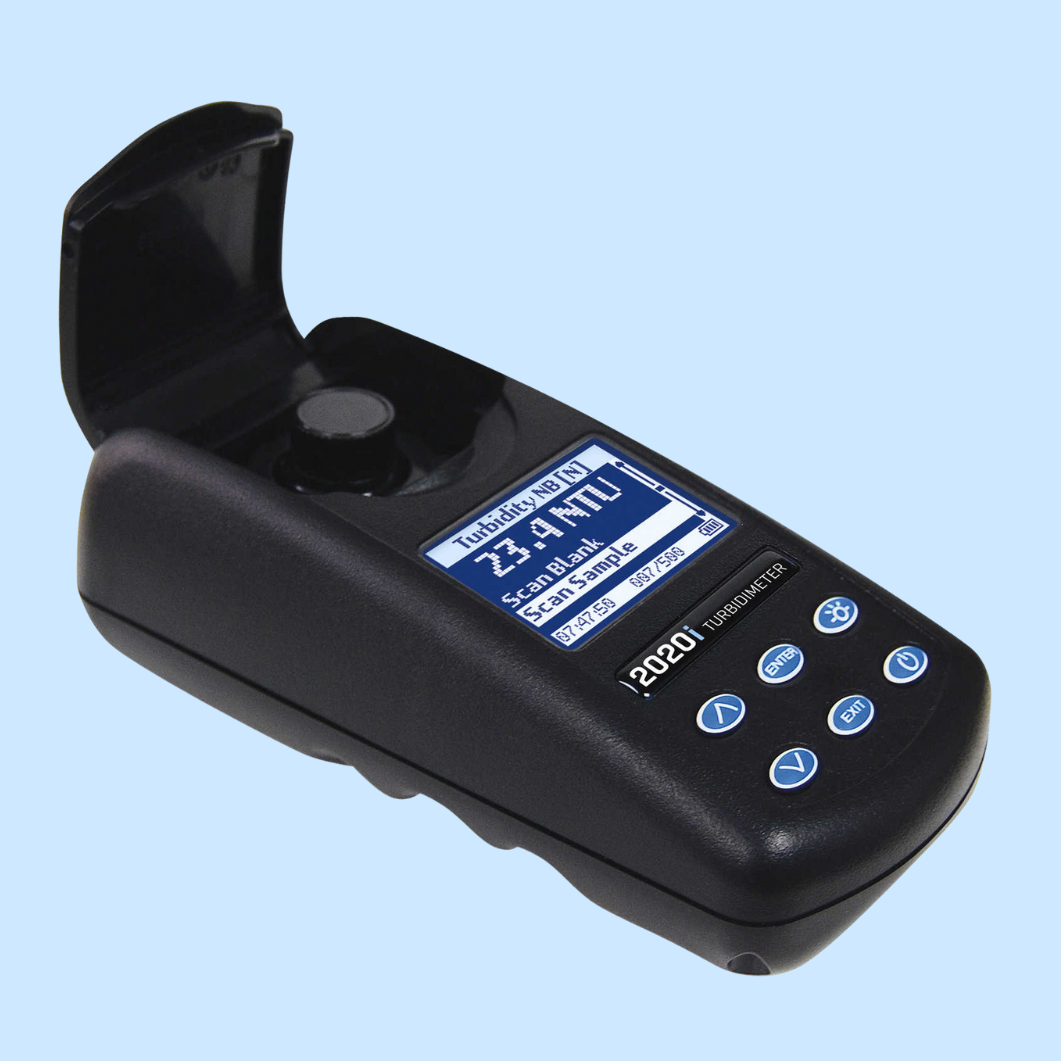
Turbidity is a measure of the amount of suspended particles in water. High turbidity levels, above 10.0 NTU, can be deleterious to many aquatic organisms. It can be indicative of excessive erosion in the watershed.
No sites recorded values above this threshold.
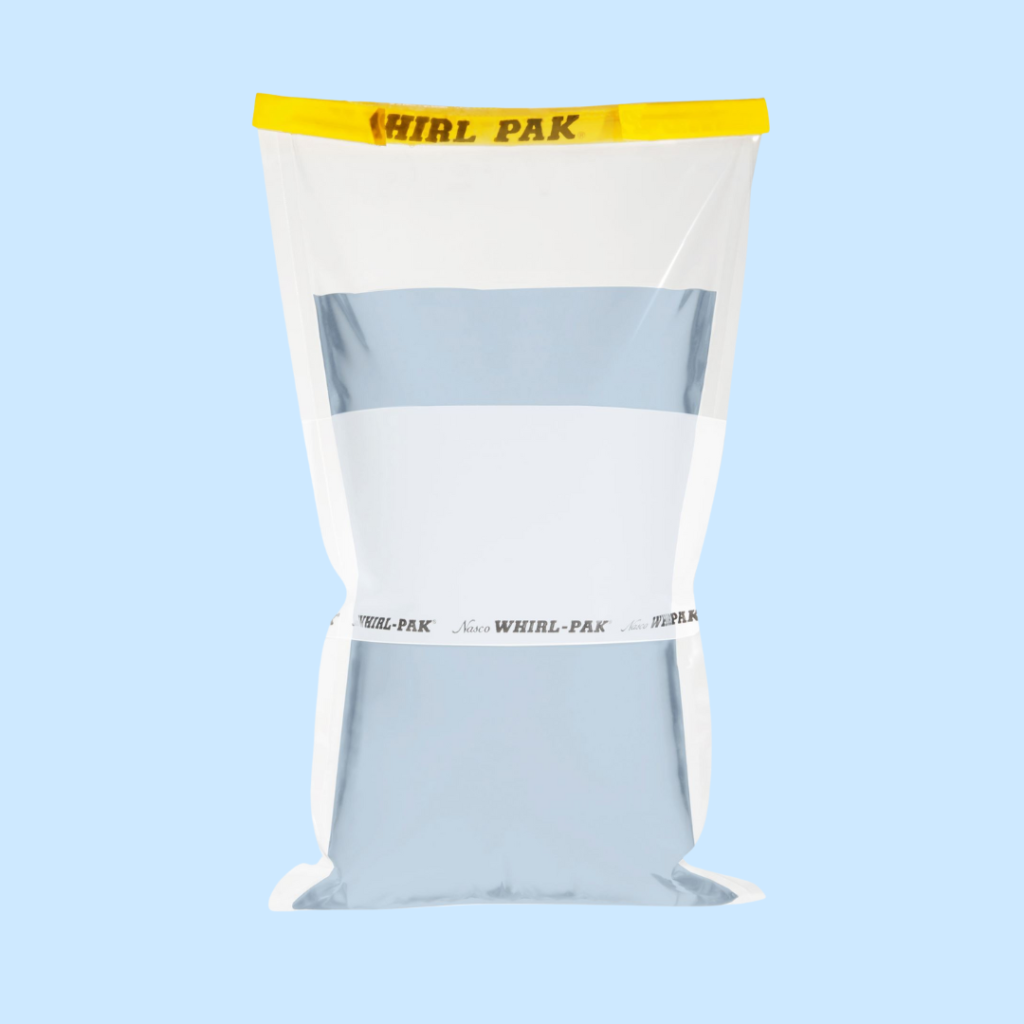
Levels of total coliform and E. coli can be used to assess bacteria contamination in local waterways and the potential risk to humans recreating in these waterways. The EPA safe recreation threshold is 320 MPN.
One site, Deer Creek 15, recorded levels above this threshold.
The maps were very hard to read. It would have been more informative if they were larger and had a few more listings to help people locate where they are located.
Thank you for your work. I appreciate it very much. Steve
Hey, can’t find bear river #13 on this map. Where is it? and also, are the dates just ‘summer 2022″, or are they more specific. The other question standing is why are we looking at posting signs for elevated ecoli levels in pioneer park when none are recorded here?