As we move into spring with snow still on the ground, we wanted to revisit this topic and give a brief update on where we stand now. The atmospheric rivers have continued to provide us with rain and snow, filling creeks and reservoirs and contributing to a snowpack for the record books! Let’s take a look at what happened this winter.
Stream flow
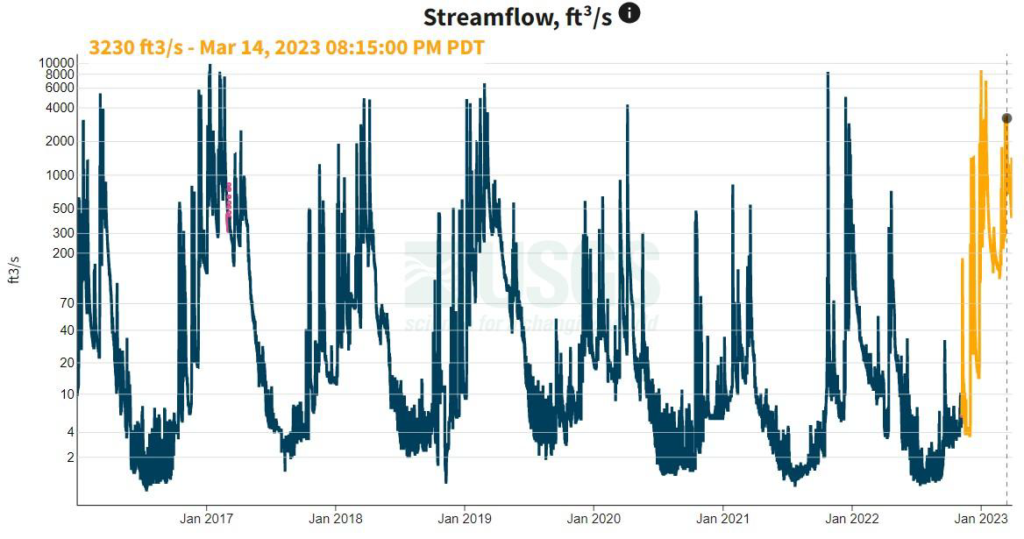
The figure above shows discharge (measured in cubic feet per second, ft3/s) in Deer Creek at the Smartsville gauge at Mooney Flat Rd., just above the confluence with the Yuba. As you can see, the continued rain has extended the period of high streamflow, and it’s looking a lot like the 2017 water year in the creeks! It will be interesting to see if this summer’s flows stay a little higher than the last few years, when groundwater levels were depleted and flows dipped to 1 ft3/s.
Reservoirs
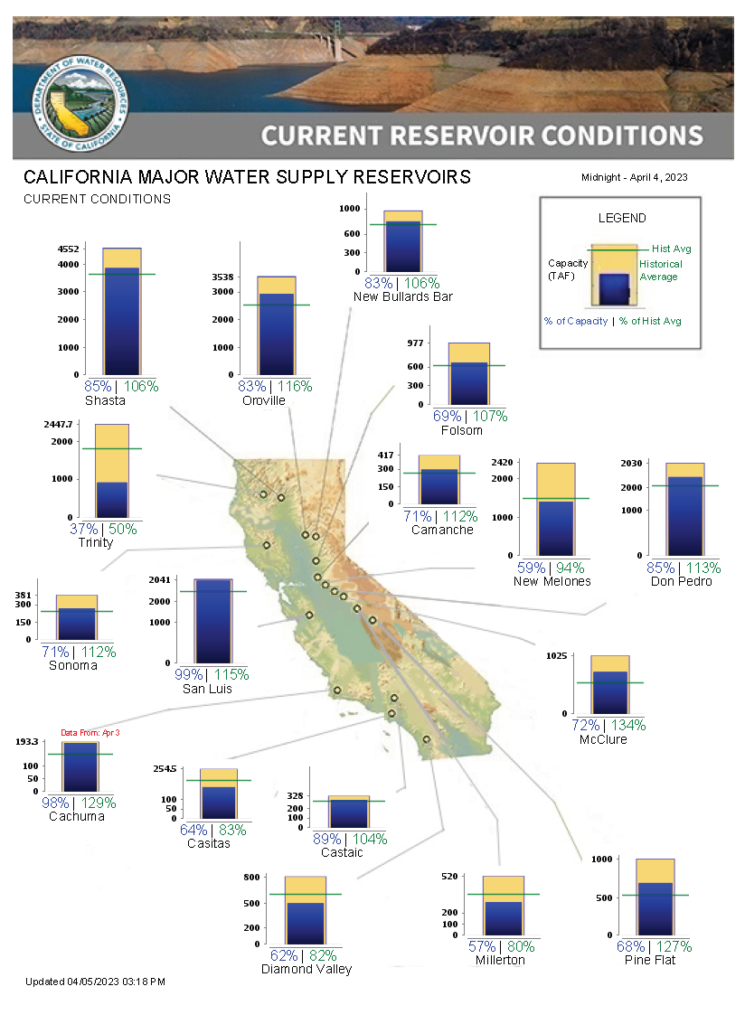
Many of our smaller reservoirs are either above historical average capacity or almost completely maxed out, but again, the big indicator our state uses for drought severity is related to the Shasta, Oroville, and Trinity reservoirs. This is because these three reservoirs alone provide the majority of water to the whole state! Currently Oroville and Shasta are both a bit above historical average for this date, but Trinity continues to lag behind at about half of its historical average. The demand on these reservoirs is much higher than the others, and they will take longer to recover from a multi-year drought. But overall, things are looking pretty good!
Snowpack
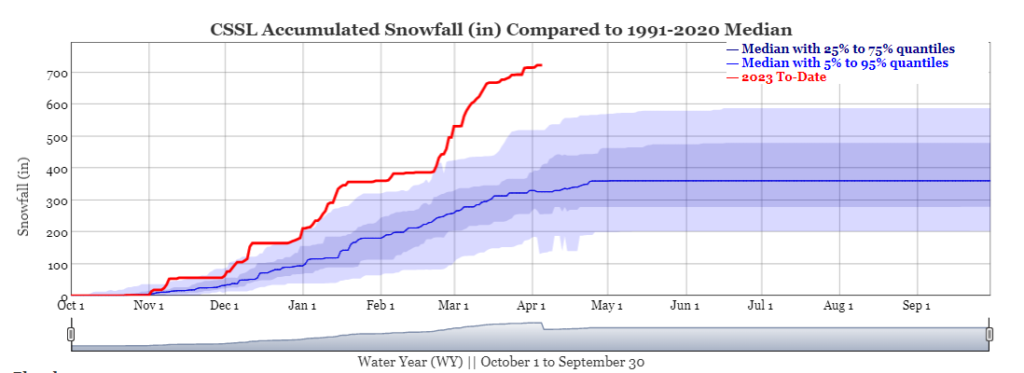
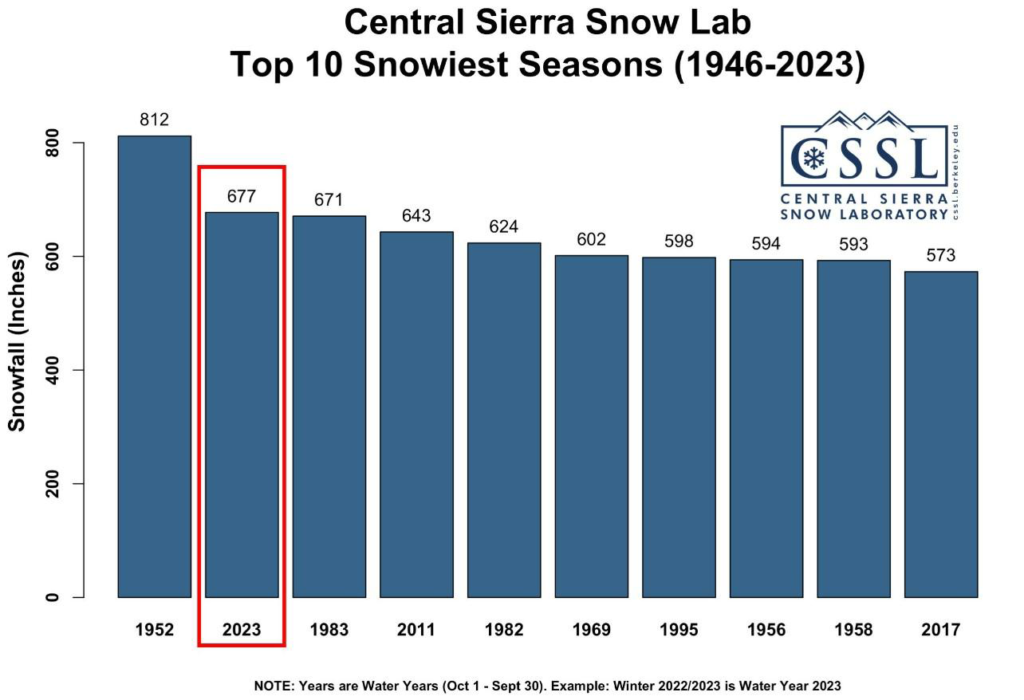
As I think we all know by now, it’s snowed a bit this winter! The result is that the snowpack is looking good – we had a record March and now rank as the number 2 snowiest season since 1946, according to the Central Sierra Snow Lab.
Drought
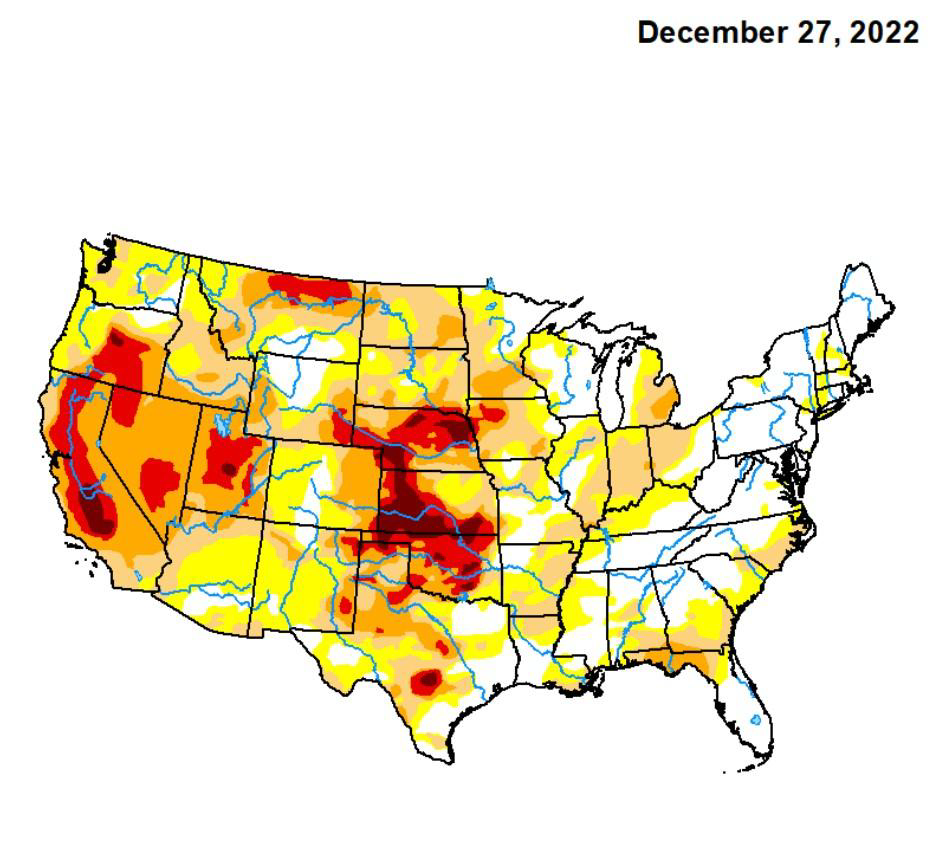
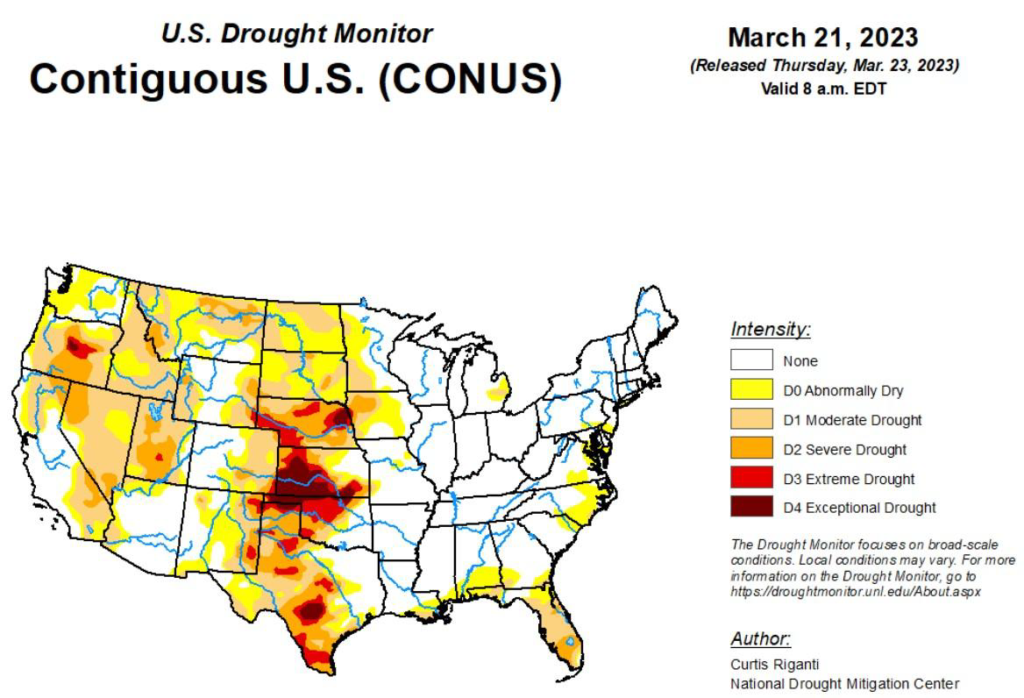
So what does all this mean for the drought? Well, the image on the left was drought severity as of December 27, 2022, while the image on the right is updated as of March 21st! While we still have some areas of moderate drought as we recover from multiple years of water drawdown, much of the state is now experiencing no drought. We can’t say how long this will last, as climate change makes California’s weather increasingly variable, but it’s nice to have a good water year!
This year we launched a targeted storm water monitoring program (I know, we picked a good year) and our stalwart volunteers were out in four of these storms. Look out for another post with our water quality findings soon!