Researchers, led by Emma Walker, at Sierra Streams Institute’s Benthic Macroinvertebrates (BMI) lab recently started working on a new scientific paper after successfully presenting their preliminary findings at the Sierra Nevada Science Symposium. The paper focuses on the impact of water flow on stream bug communities and relies on extensive data collected from 2003 to 2015 at over 11 sites spread throughout the Deer Creek watershed by SSI. The data is deemed particularly useful when analyzing how BMI communities respond to extreme weather conditions, such as severe droughts and floods, as California experienced those conditions when the data was originally being collected. Key findings from this research endeavor provide a strong foundation for future research and can help guide current watershed management practices.
Why Study BMI Communities in the first place?
The water quality monitoring program collects BMI, which as a reminder, are small aquatic insects that live in the bottom (benthic) layer of streams. Because species differ in their response and tolerance to environmental stressors, they can be used as indicators of the overall health of the stream. Additionally, they are relatively easy to collect as they do not move around much and spend a significant portion of their lives in the water.
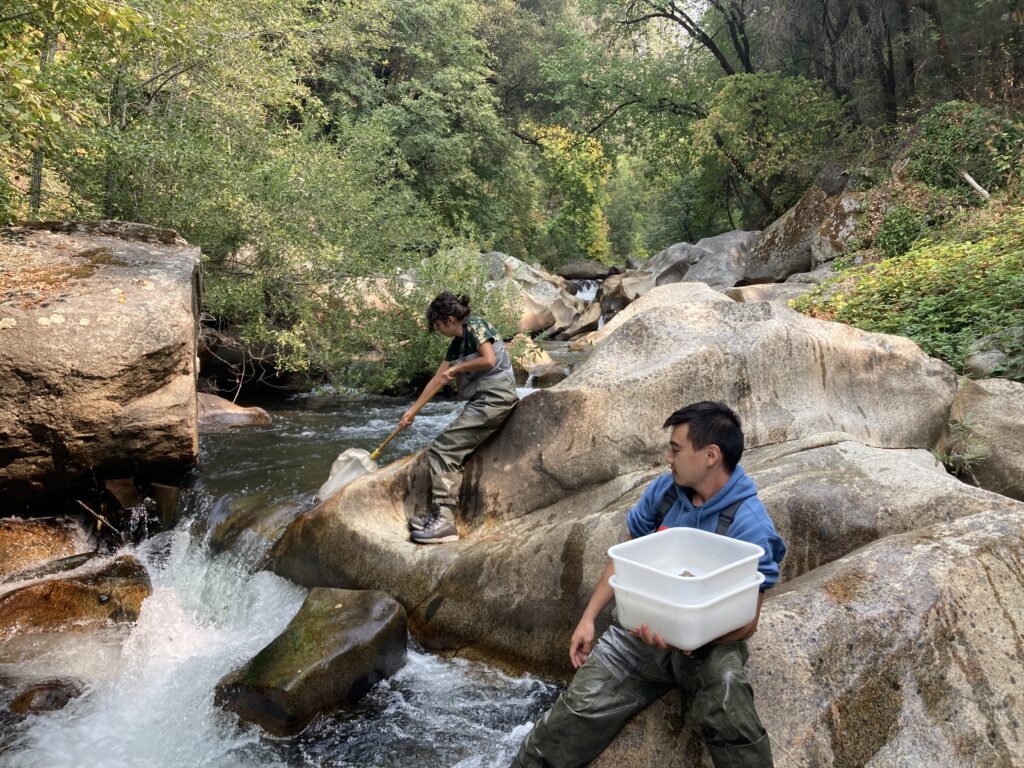
Members of the creek survey team collect streams bugs before sending them to our lab in Nevada City!
How do we collect the data?
Every year, field crews collect samples of BMIs from sites spread throughout the
watershed. Samples are collected two times per year: June, when runoff from snowmelt is at its
peak and water levels are highest; and October, when snowmelt has tapered off and water levels
drop drastically. Samples are then identified and classified to the family level by staff and community lab
Volunteers.
What are the findings?
Drastic changes in flow impact our creeks in many ways. In wet years, high water level
keep more habitat submerged and water temperatures remain cool. Streams vary between pool
and riffle habitats. In dry years, when water levels are low, we see a loss of habitat, an increase in
water temperature, and a decrease in dissolved oxygen, the oxygen organisms use to breathe. We find that samples collected during wet years are significantly different from samples collected during dry ones. However, the drivers of this change vary based on watershed location. In the upper watershed, we find that wet years are positively correlated with higher community diversity and richness, higher abundance and diversity. Conversely, in the lower watershed, it is dry years that are correlated with higher community and diversity and richness.Diving deeper into these results, we find that the communities in the upper watershed are made up of organisms that are more sensitive to changes in their environment, primarily warmer temperatures and lower levels of dissolved oxygen; these are conditions which become more common in drier years. The lower watershed, on the other hand, is dominated by more generalist species, which can tolerate and adapt to a greater range of conditions.
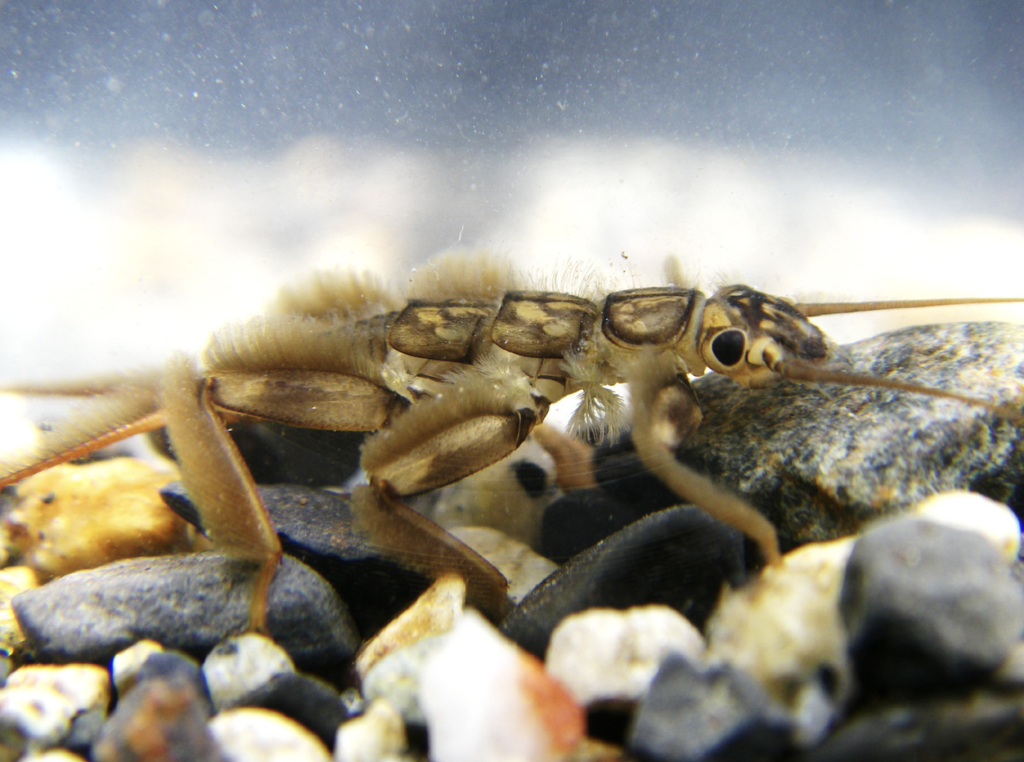
Stonefly larvae (pictured above) are among the predators of the BMI communities and are extremely intolerant of pollution. Other common BMI species collected in our creek samples are caddisflies, mayflies, and midges.
What does this mean for the future?
The differences in community structure within our watershed has larger implications for
restoration and management. Multiple climate models have predicted more variable and extreme weather patterns as climate change intensifies, meaning a higher frequency and intensity of both droughts and floods. Our lower watershed communities may be better adapted and more resilient to disturbances but will likely face more severe extremes. Our upper watershed communities will be more sensitive to changes and may require greater protection through restoration. Further baseline monitoring is recommended to get a better understanding of long term trends in biological communities, but these results help us better refine monitoring sites in the future and show the importance of on-going “baseline” monitoring!Further, we now have an idea of which BMI families serve as the best “indicators” of each habitat, allowing us to get instant feedback about site health when those particular critters start showing up more or less in certain samples. Finally, this gives us an interesting look at the nuance around biodiversity. Higher biodiversity is often considered a metric of health, but in this case, higher biodiversity in the lower watershed was actually an indicator of stress. So this shows the importance of understanding the “whole community” response to change! Biodiversity is always important to protect and preserve, but it may be even more important to know which species make up that biodiversity and what it actually means with regards to ecosystem health!
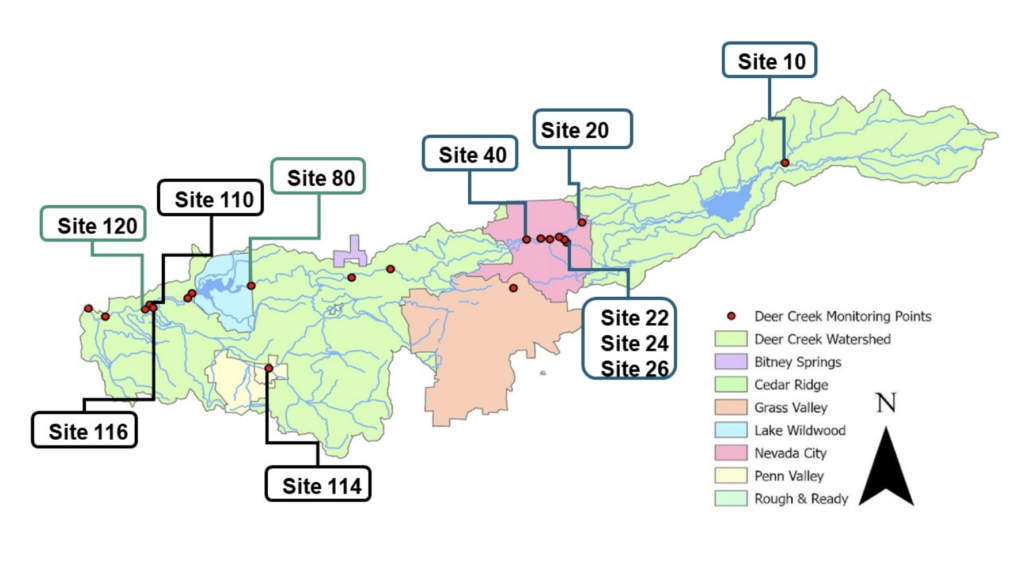
Map of the study area that includes the location of sites. Sites ( 10,20,40) and sites (120,116,110) are considered to be upper and lower watersheds respectively.
How can I help?
Help us track creek flows this summer! Damage to PG&E’s water infrastructure may impact water levels in Deer Creek and Bear River this summer (read more about it here). Help us see what our waterways look like during this time by taking pictures and uploading them to our online form! Photos will go into a publicly accessible online database (which is just about complete and ready to share with all of you!), which will help us track what water levels look like in Deer Creek and Bear River and the impacts of the equipment failures. You can read more about PG&E’s timeline on the repairs here.Further, you can help by helping us collect our quarterly water quality samples, our bi-annual BMI samples, or by making a donation on our website! This research is almost entirely community-funded and driven, and we can’t conduct it without your support!
Why is your help important?
Currently, real-time flow levels are only measured at one place in Deer Creek, and four places on the Bear River. On Deer Creek, this gauge is downstream of a dam (Lake Wildwood), with no gauges in the upper watershed, while on the Bear River, most of the gauges are also below dams or at significant highway crossings. This lack of continuous flow data makes it challenging to study the health of our local bodies of water as flows change both seasonally and as a result of impacts like the damaged PG&E infrastructure upstream.. As the research we have shared above shows, flow matters! Further, using “natural experiments” like damaged infrastructure or dry versus wet years gives us unique insights into how streams respond to future stress under climate change. However, we can’t be everywhere all at once! While intensive streamflow monitoring with accurate gauges is something we do at a few select sites throughout the year, by getting your snapshots—especially of the same sites at multiple times throughout the year—we can get a “qualitative” look at how flows are declining, and include those assessments in our analysis of biological responses to drought. So keep sending in those photos!