Sierra Streams Institute works with community members to monitor the health of Deer Creek, our home watershed, as well as the Bear River. Collecting these data regularly over time allows us to observe changes, evaluate the impact of restoration efforts, and locate sources of potential problems.
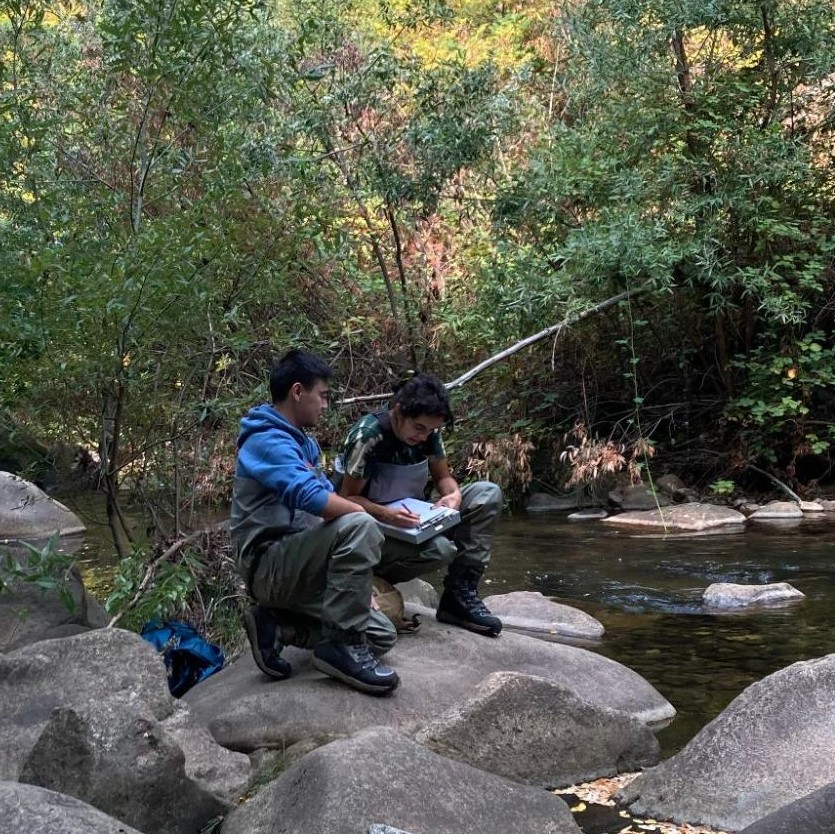
Our quarterly baseline monitoring collects data on water temperature, dissolved oxygen, conductivity, pH, and turbidity; these “vital signs” tell us how the creek is doing and what kinds of life can inhabit its waters. We also check nutrient and bacteria levels, which are important for algae growth and safe swimming.
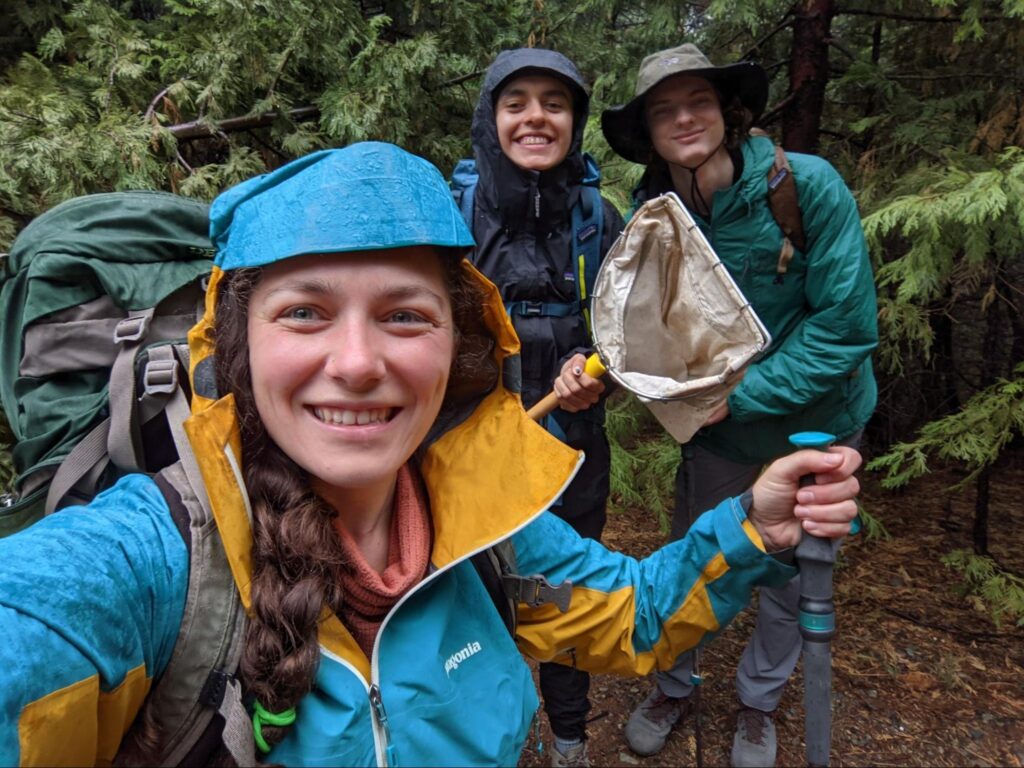
Our targeted monitoring collects the same baseline parameters specifically during winter storms and the hottest part of the summer. By seeing how the creek is doing at these “extreme” times, we have a better understanding of creek conditions year-round.
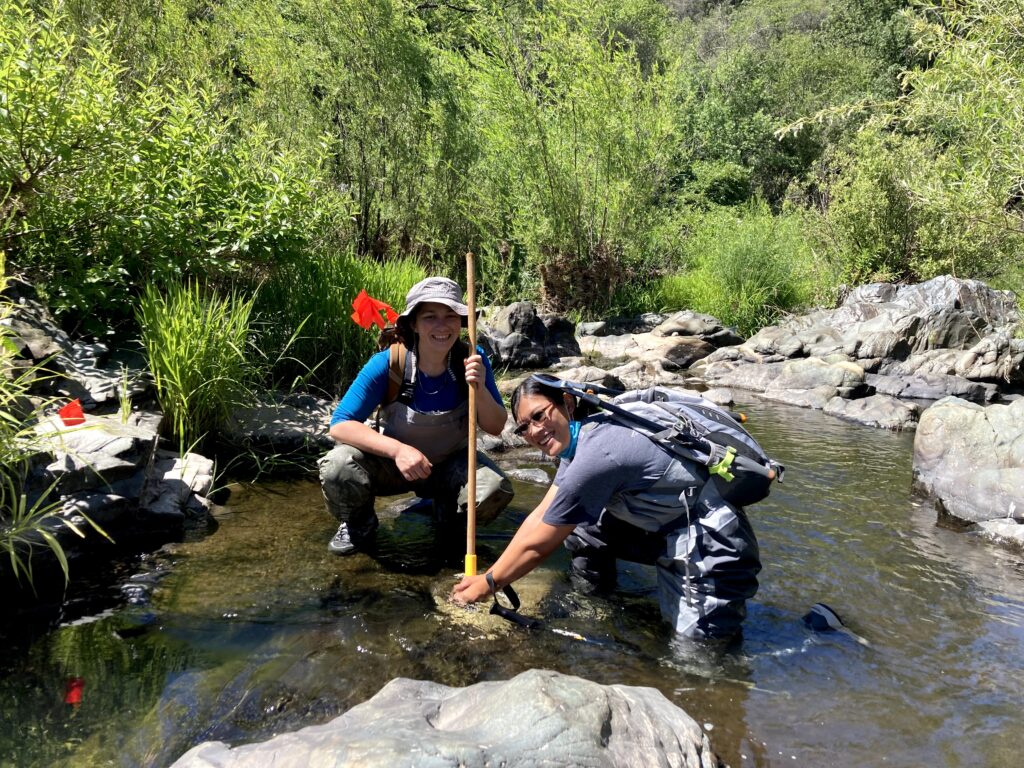
Our annual creek surveys are an in-depth collection of data on benthic macroinvertebrates (BMI), algae, and the physical habitat of the creek. This is an important addition to our data on water chemistry (temperature, pH etc.) because it gives us direct information on what lives in the creek and the nitty gritty on what the creek looks like.
Together, keeping track of the trends in water chemistry, BMIs, and algae that a creek supports helps us understand the creek ecosystem as a whole. We can then take into account large scale factors such as drought and wildfire, and determine the success of riparian restoration projects. Everything in a watershed is connected, from the headwaters all the way downstream, and it’s connected by water.
Learn More About Our Local Watersheds
Monitoring FAQs
What does SSI monitor for?
Vital Signs
Our water quality monitors collect data on “vital signs,” which tell us how the creek is doing and what kinds of life can inhabit its waters:
Dissolved Oxygen
Aquatic organisms depend on oxygen for to breathe (respire). Oxygen can be dissolved in water through aeration, moving over rocks and waterfalls, and photosynthesis. Cold water can hold more dissolved oxygen than warm water, because the molecules in the water move slower and less dissolved gas is lost.
At least 5mg/L (milligrams per liter) of dissolved oxygen is necessary for supporting aquatic life, and above 8mg/L is preferred by most aquatic species.
Specific Conductivity
Specific conductivity measures the concentration of charged particles present in water. Charged particles include different kinds of salts, nutrients like nitrate or phosphate, and other ions. Conductivity may be related to the underlying geology of the stream bed, or come from urban runoff containing things like fertilizers. Because ions can move faster in warmer water (it is less viscous), the conductivity of water increases with rising temperature. We compensate our readings to a standard temperature to minimize this effect, and refer to it as specific conductivity.
Generally it is easier for creek critters to live with lower conductivity, although it depends because conductivity can be such a wide variety of things, some of which are necessary to aquatic life in small amounts.
Turbidity
Turbidity refers to the clarity of the water, with low turbidity indicating clearer, healthier water. Sediment or dissolved solids in the water can stick in the gills of fish, settle on top of fish eggs, and even impair fish’s vision in their hunt for food. Filter-feeding invertebrates can also become clogged with sediments, leading to starvation. Because solids heat up faster than water, high levels of solid material in water can increase the temperature of the water, which leads to lower oxygen levels (see dissolved oxygen section).
Rainfall often increases turbidity in creeks for a short time, as stormwater runoff contributes to higher flows and can cause creek-bed and watershed-scale erosion. Other sources of increased turbidity include algal blooms, waste discharge, and even animals or children playing in the water.
Fish prefer very clear water, with a turbidity of less than 10 FAU (Formazin Attenuation Units).
Temperature
Water temperature affects all creatures living in the stream, as well as directly influencing water chemistry (see conductivity and dissolved oxygen sections). Deep, fast-moving, and shaded streams tend to be colder than shallow, slow-moving, and exposed streams.
Different animals have different preferred temperature ranges; cold water fish such as rainbow trout like water to be less than 16 degrees Celsius, although they can tolerate higher temperatures.
pH
pH is a measure of how acidic or basic the water is. pH in streams can be affected by many things, including urban runoff, mining activities, and even pine needles. Typically, the presence of organic matter and decomposition decrease pH, making the water more acidic, while urban runoff tends to increase pH.
A pH range of 6.5 to 8.5 is optimal for the health of freshwater fish and bottom-dwelling macroinvertebrates.
Nutrients/Bacteria
Our monitors also check nutrient and bacteria levels, which are important for algae growth and safe swimming.
E. coli as an indicator bacteria
E. coli is found in the feces of warm blooded animals, including humans, and is used as an indicator bacteria. This means that it is both easy to test for and also tends to be present when other, more harmful bacteria and microorganisms are present. (Some strains of E. coli are harmful, but most are non-pathogenic and live harmlessly, in fact helpfully, in our bodies.)
Sources of E. coli include animal and human waste, and tend to be more concentrated in urban areas, for example near dog parks or during sewage leaks. When levels of the indicator E. coli are high it means that people (especially small children and the elderly) should avoid contact with the water. We use EPA-established safe thresholds for E. coli to determine if certain areas should be closed to creek access temporarily.
We tend to see increases in bacteria at many of our monitoring sites during the summer as the temperature increases and water flow decreases. While some amount of bacteria is always present in creek water, lower water levels can concentrate bacteria and higher temperatures can increase the amount of time bacteria can live, and multiply, in the water.
Nutrients
Nutrients are essential “building blocks” for all life, from humans to algae and bacteria. While nutrients are necessary for life in creeks to persist, in excess they can lead to overgrowth of algae, low oxygen conditions, and in severe cases “dead zones”.
Nitrate (NO3–) is formed from the elements nitrogen and oxygen. Sources of nitrate pollution include fertilizer, animal waste, human waste (often from leaking septic systems or overloaded wastewater treatment systems), and industrial pollution. Nitrates are a critical nutrient for aquatic plants and algae, which need nitrogen to grow. However, high levels of nitrates can lead to overgrowth of algae and eutrophication (areas where there is little or no oxygen in the water).
Phosphate (PO43-) is formed from the elements phosphorus and oxygen. Phosphate is another important nutrient for aquatic plants and algae, and just like nitrate too much can lead to unchecked growth and low oxygen conditions. Sources of phosphate pollution includes urban landscape runoff such as fertilizer and detergents, as well as human and animal waste.
Header text
BMIs and Other Organisms
During our annual creek surveys, we collect detailed information on what lives in the creeks and the physical habitat of the creek. We also work with SSI’s restoration team, landowners, and other Fee for Service contractors to conduct biological surveys for threatened and endangered species.

BMIs
Benthic macroinvertebrates (BMIs) are small animals living at the bottom (benthos) of streams that are large enough to see with the naked eye (macro) and have no backbone (invertebrate). Because BMIs live in a variety of habitats and have a range of tolerance levels to pollution, they are excellent indicators of stream health. Looking at the BMIs that live in a creek allows us to evaluate long-term trends in watershed health, rather than the snapshot in time we get from our baseline water quality data. For example, stoneflies have a very low tolerance for pollutants, so if the creek supports a thriving stonefly population, water quality must have been good for some time.
Algae
Algae are a diverse group of photosynthetic organisms that live in water. Like plants, they produce oxygen through photosynthesis, but individual algae are microscopic although they often live in large colonies and can thus be seen. Algae need nutrients to grow, and are an important part of the food chain in creeks, but overgrowth of algae can lead to problems like eutrophication.
The SSI team collects algae samples during our creek surveys to get an understanding about how much food is available to larger organisms. We are currently developing additional methods that will help us better understand what types of algae are growing in the creek!
Biological Surveys
In addition to BMIs and algae, SSI sometimes monitors for larger animals – often threatened and endangered species. SSI works with the Lake Wildwood Association to monitor for salmon below the lake and western pond turtles in years the lake dredges. As the lake releases water, it can attract salmon up Deer Creek where they can get stranded if flows drop down too quickly. SSI helps confirm whether salmon have travelled up the creek and confirms when they have made it back to the Yuba River.
SSI also monitors for multiple species at our restoration sites and as a Fee for Service, including birds and beavers. We implement camera traps to capture more elusive species, like mountain lions and river otters. This monitoring helps us understand what non-aquatic organisms use the creek and inform our restoration practices to enhance the available habitat or avoid working in areas where sensitive species have taken up residence.
Physical Habitat
During our annual creek surveys, the SSI team also measures the physical habitat in the creek.
The physical habitat of a creek includes how wide it is, how deep it is, how much it curves, how much water moves through it, and what the surrounding area looks like. For example, are there lots of trees and shrubs? Are there a lot of roads and bridges right next to the creek? The answers to these questions provide important information about what it’s like to live in the creek, and can also help us track how the creek changes over time.
When does SSI monitor?
Baseline Monitoring
Our quarterly monitoring occurs every three months in January, April, July, and October. We have been monitoring Deer Creek for over 20 years now and Bear River since 2016. These long-term data sets give us an overall understanding about what the water is doing year-to-year during each season, which we refer to as our “Baseline”.
Targeted Monitoring
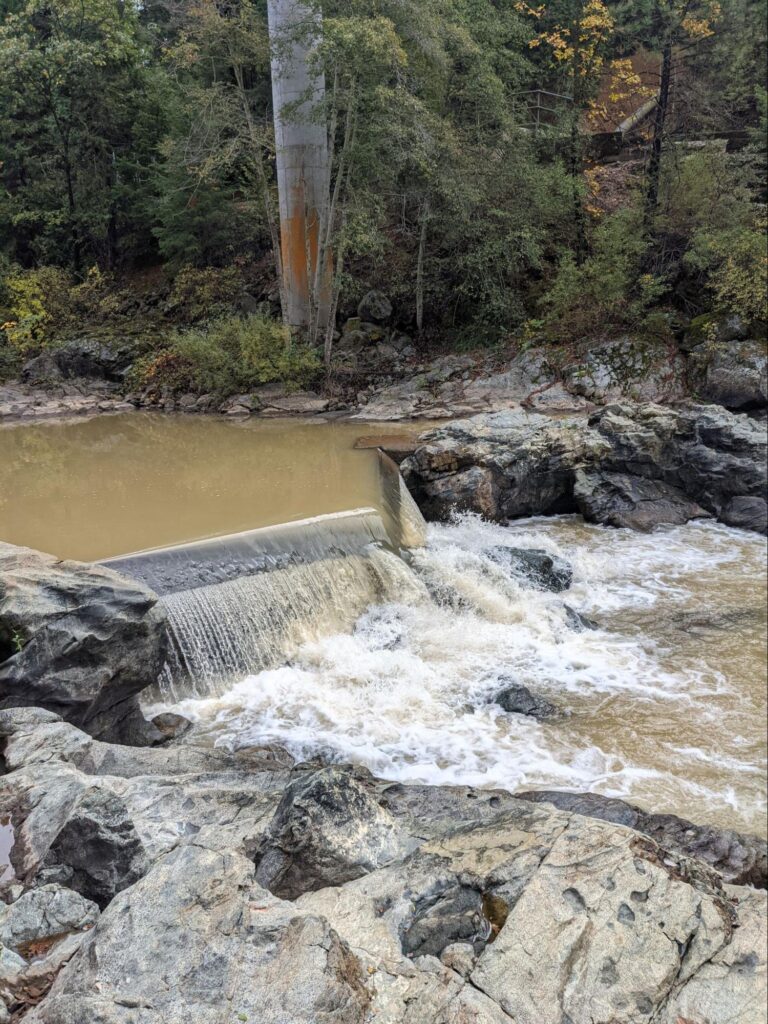
In addition to baseline monitoring, we are also interested in the extremes: What is the creek like during a winter storm? What is it like in the late summer, when it is at its hottest and driest? Starting in 2022, teams of volunteers have been going out to collect all our normal parameters during these extreme times so that we can have a better understanding of the creek at all times of the year, and how things might change with increasing climate variability.
Creek Surveys
In June and October, we do in-depth surveys of algae, benthic macroinvertebrates (BMI), and additional biological parameters at a smaller subset of our regular monitoring sites. In June we also do a full survey of the physical habitat of the creek and surrounding riparian area, which means looking at tree cover and what kinds of substrate (boulders, sand, or cobble) are available to the organisms that live in the creeks.
We train community volunteers to help us with all these aspects of monitoring the health of the creek! Learn more here.
What is a watershed?
A watershed is an area of land where, when it rains, all the water flows downhill to the same place. For example, when you hold your two hands together palm-up, imagine that the lines between your fingers are creeks, and the raised areas of your fingers are mountains and ridges. The smallest watersheds are in-between your fingers. Each hand is also it’s own watershed, and your two hands together create the largest watershed!
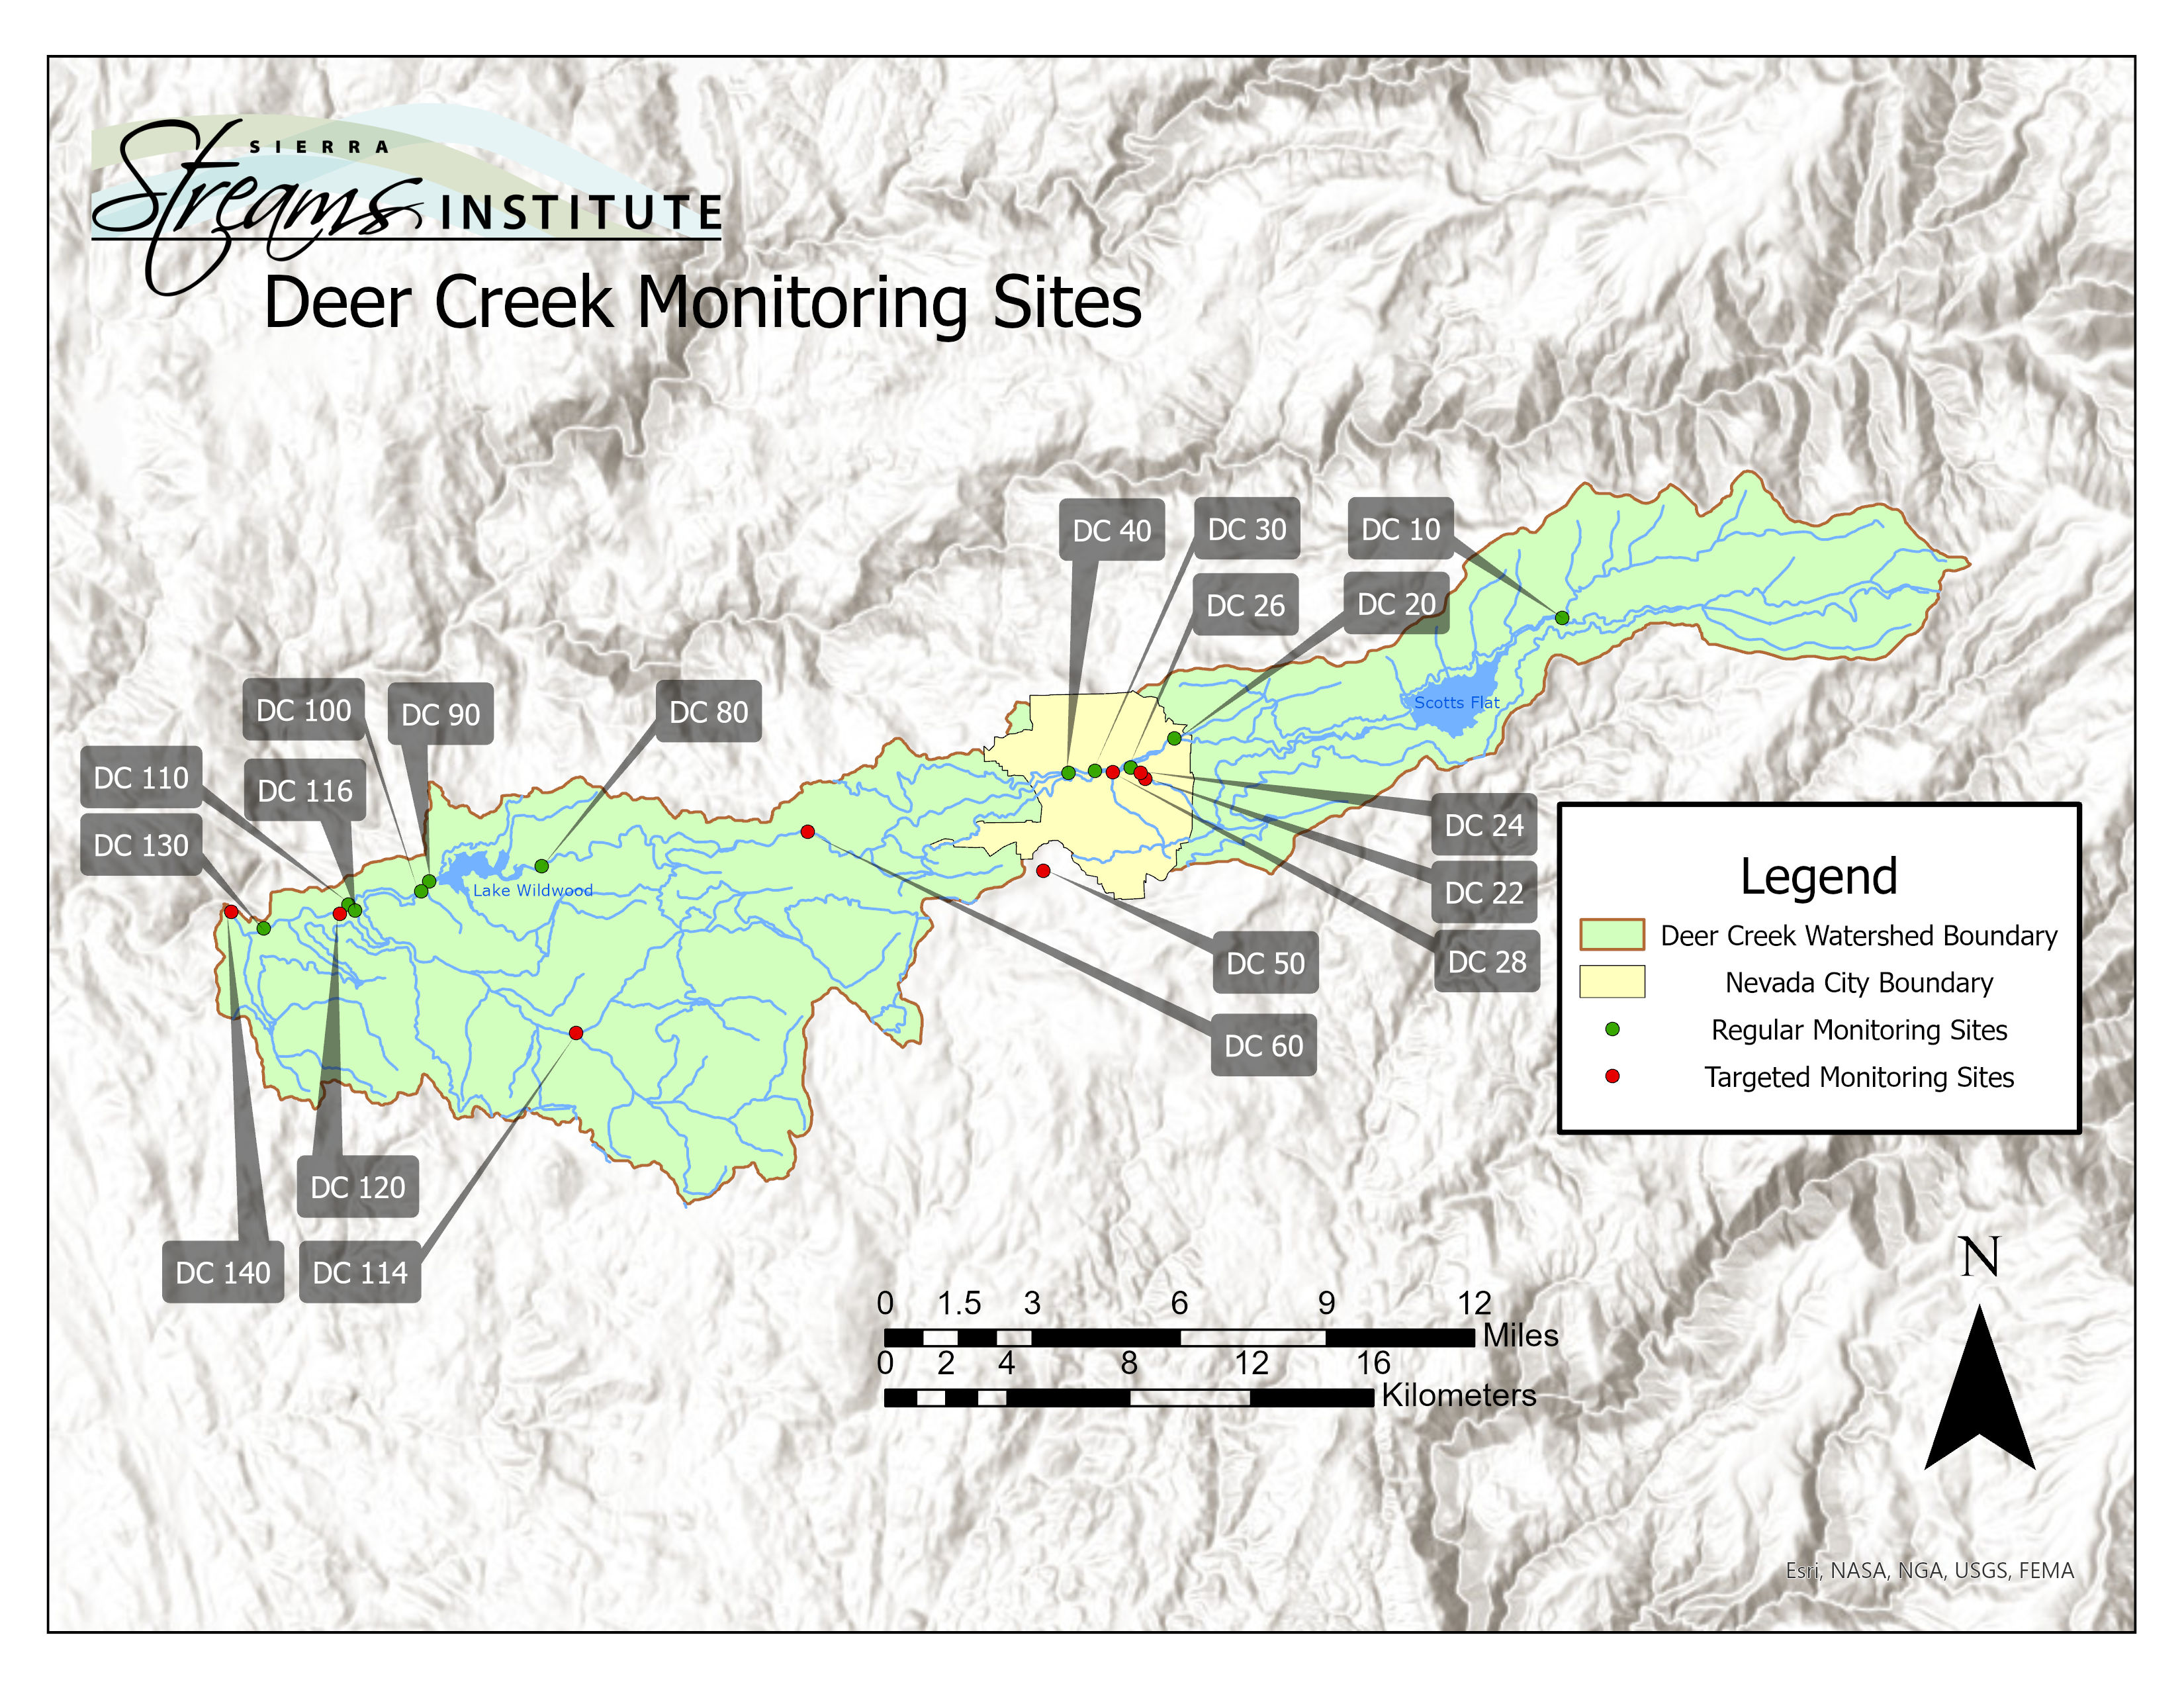
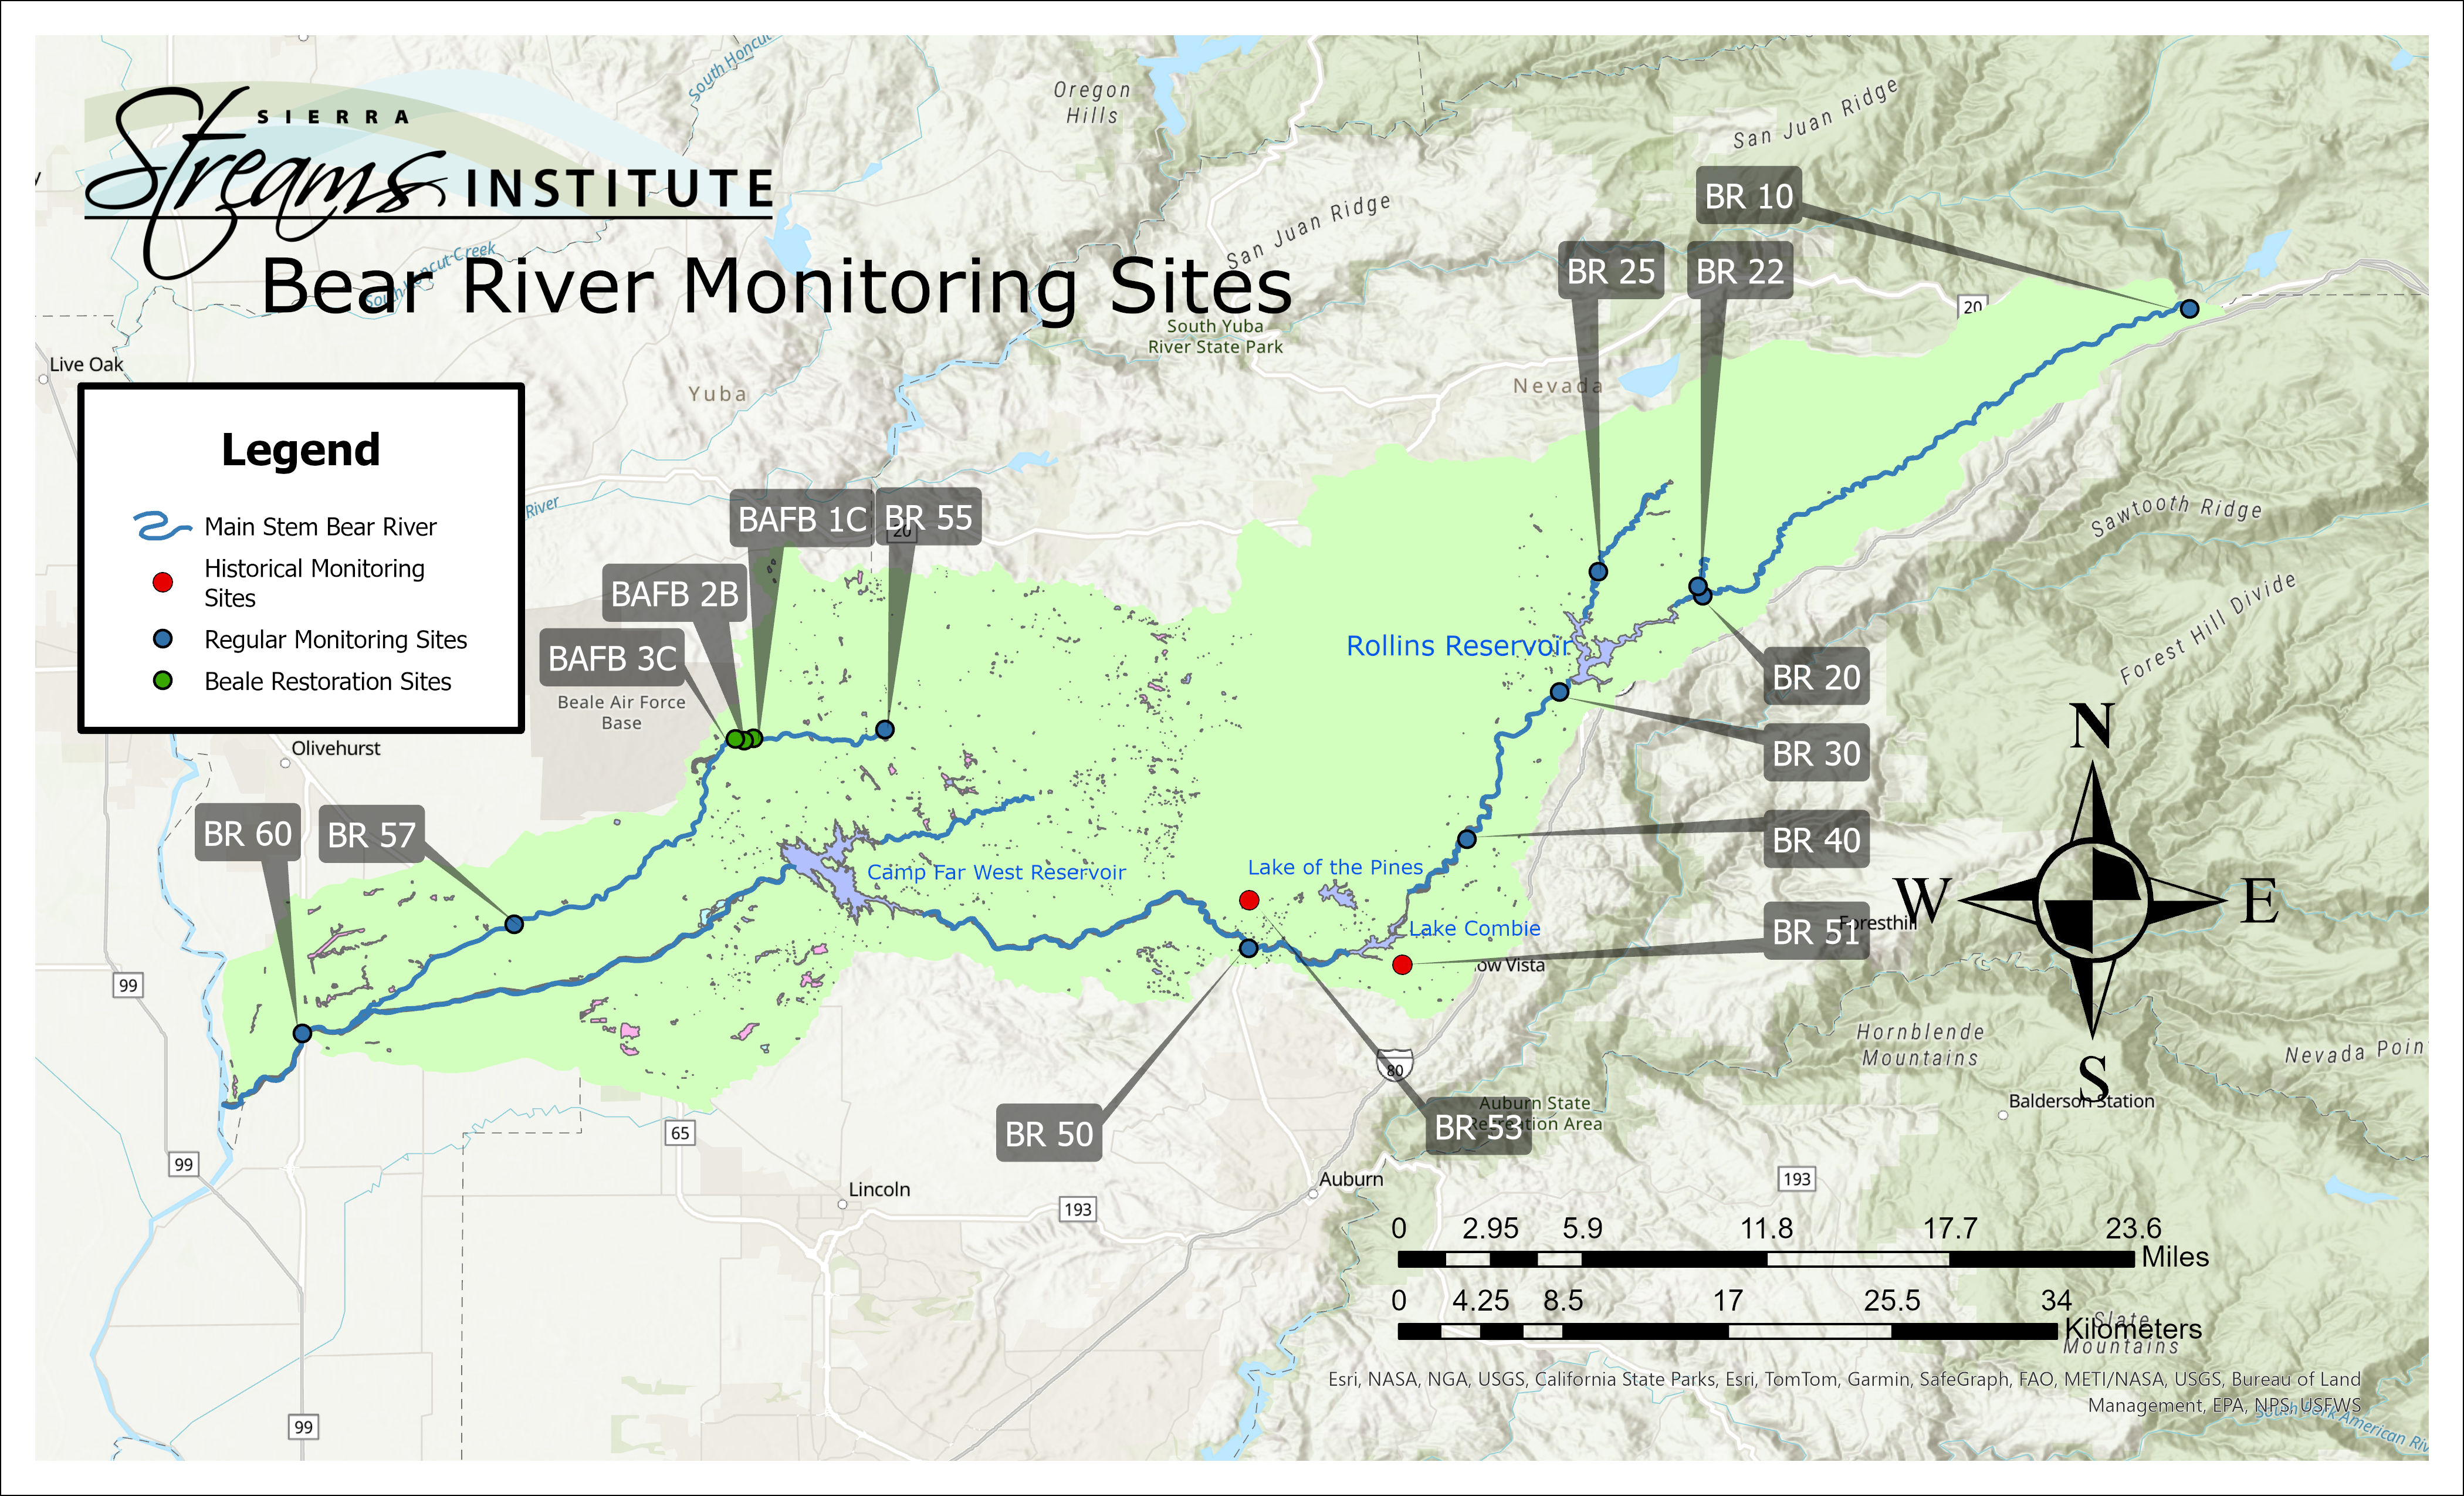
All of the land that drains into Deer Creek is the Deer Creek watershed. Deer Creek eventually flows into the Yuba River. All of the land that drains to the Yuba River is the Yuba River Watershed, which includes the Deer Creek Watershed. Below are maps of the Deer Creek Watershed and Bear River Watershed, including SSI’s monitoring sites.
Is there anything I can do to reduce my impact on the watershed?
There are several ways that humans impact watersheds. We pave over large sections of ground, which wash pollutants directly into creeks when it rains via gutters and storm drains, and reduce the amount of water that can filter through the soil to recharge groundwater reservoirs. We build homes near creeks, which can be a source of soil erosion and household chemicals and fertilizers. Treated sewage discharge drains into creeks, and contains much higher levels of nutrients than the creek would naturally have. Fertilizers and pesticides can drain from farms into nearby creeks and harm the vegetation on the creekbank. Dams help ensure we have drinking water and water to irrigate year-round, but they interrupt the natural flow of the water, build up sediment, and impact water quality and fish migration.
While we can’t remove these useful pieces of infrastructure, we can minimize their impacts by adopting “creek-friendly” practices. Think about what might reach the nearest waterway via a gutter or storm drain, and act accordingly when you apply fertilizer to your garden. Support permeable paving projects in your community. Consider biking or walking rather than driving for short trips. Visitors, homeowners, developers, water management agencies, city, county, and state agencies, farmers and ranchers, and local businesses all have a role to play in keeping their watershed healthy.


