
Science doesn’t make decisions or tell you how to live your life, it only provides information
It has been a while since we last discussed our 7 principles of sound science. As a reminder, we’re ...

Needless to say, the system is in trouble, and could use some precipitation! So what about all this chatter about El Niño? Will it help the drought conditions? Will it help build snowpack?
What is El Niño?
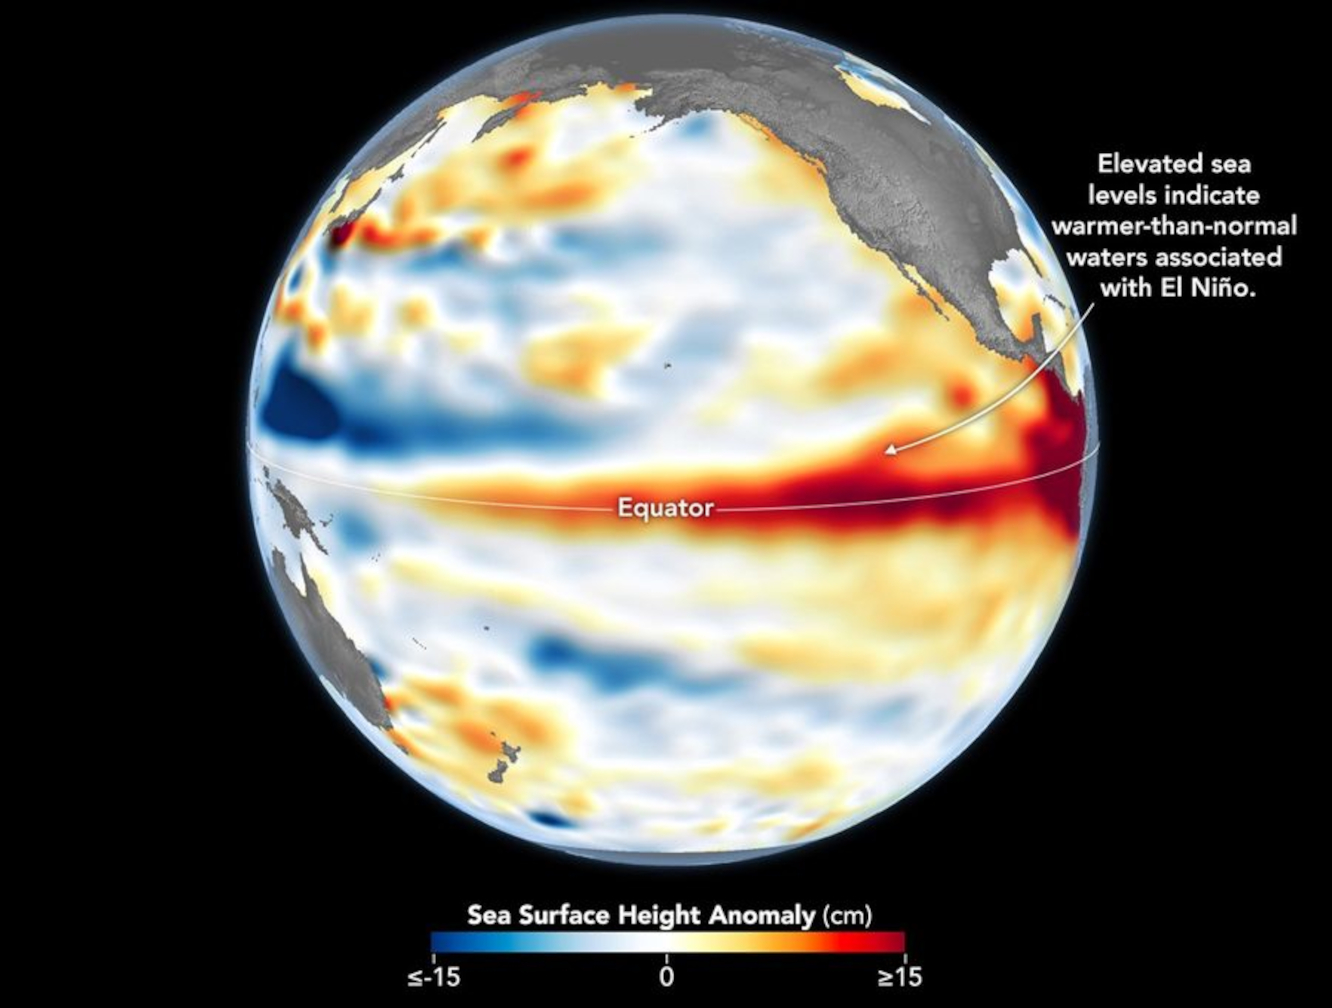
El Niño, in its simplest form, is simply a state of increased “energy” in the eastern Pacific (the portion that sits against our west coast). This is measured as a combination of water temperature at surface and at depth, as well as actual sea level, with El Niño events being associated with a ‘warm bubble’ in the eastern pacific that actually raises sea surface height. La Niña events are the opposite; cold water and less energy in the eastern pacific.
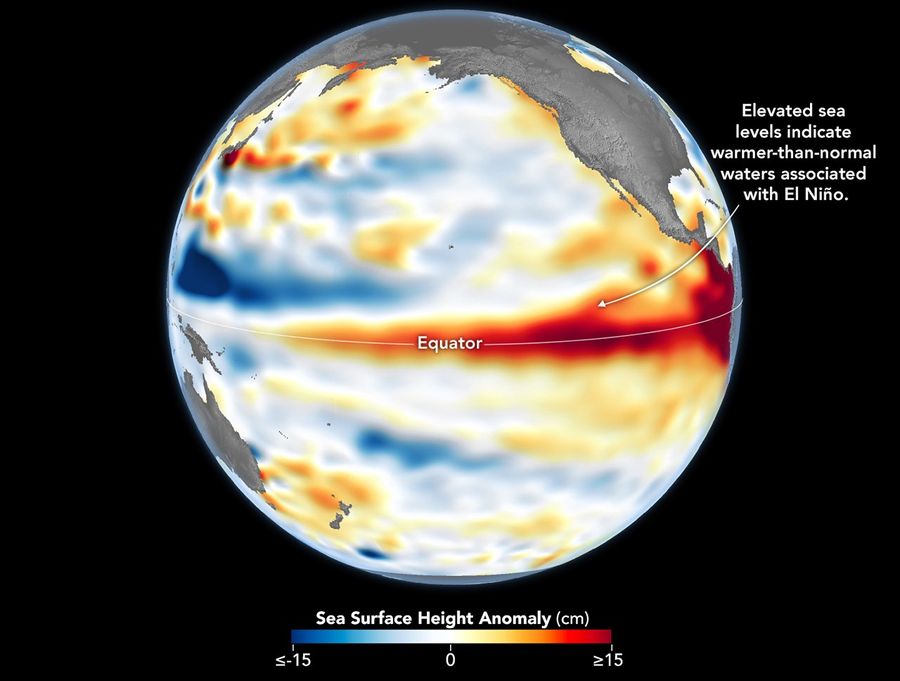
Current Sea Surface Height Anomaly in the pacific as of August 31st, 2026. Image: NASA
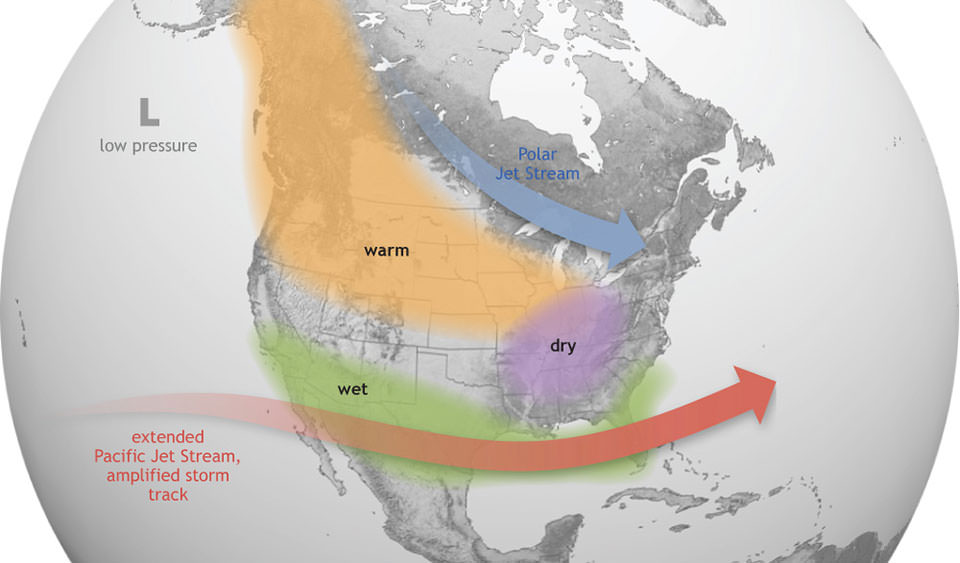
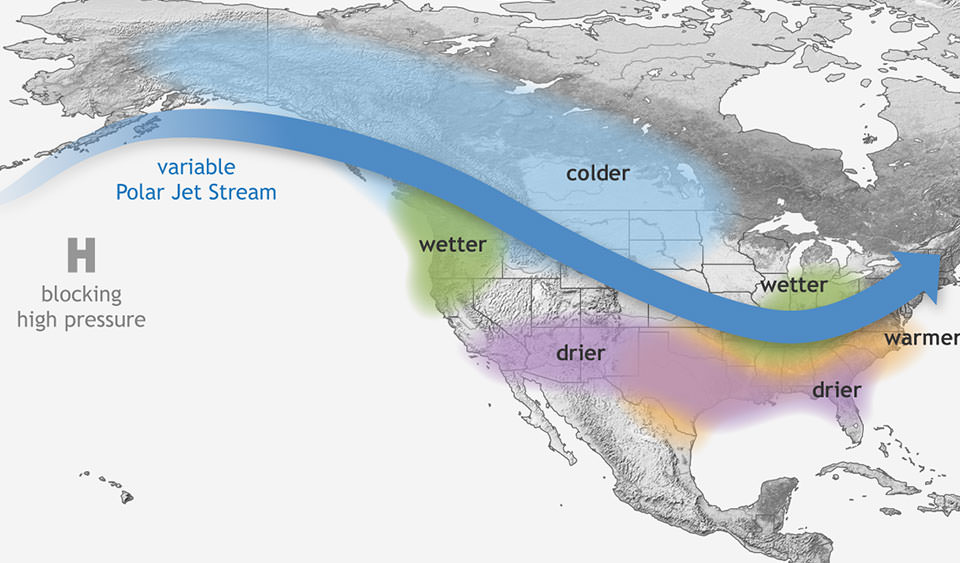
This “energy” then becomes the source of energy for intense storms, increasing moisture and overall “activity” in storms that pick up that energy. See El Niño (top) and La Niña (bottom) below.
So what are conditions currently?
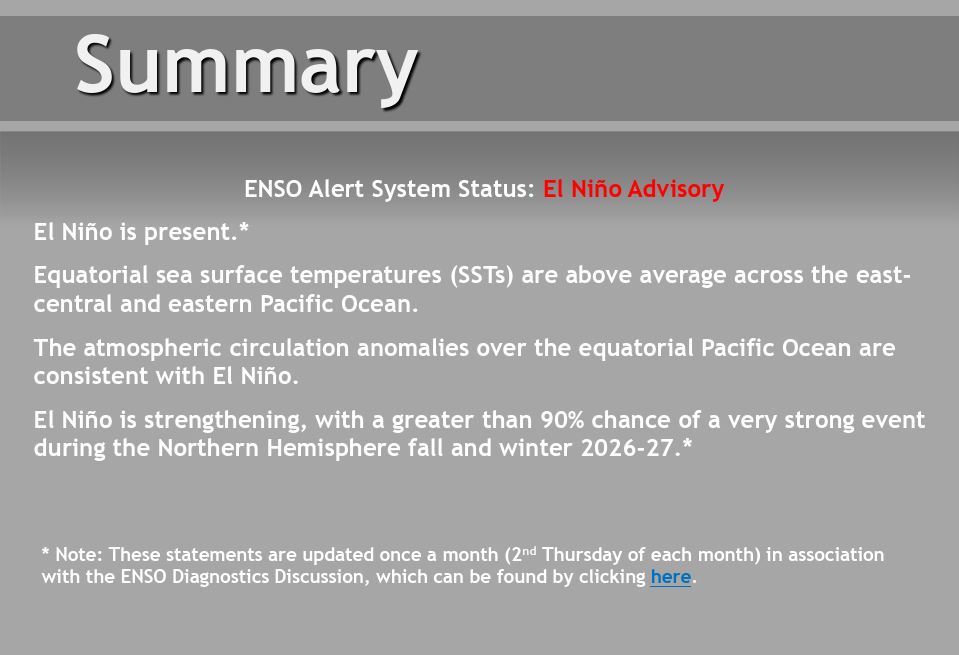
What is this “Very Strong” or “Super El Niño”?
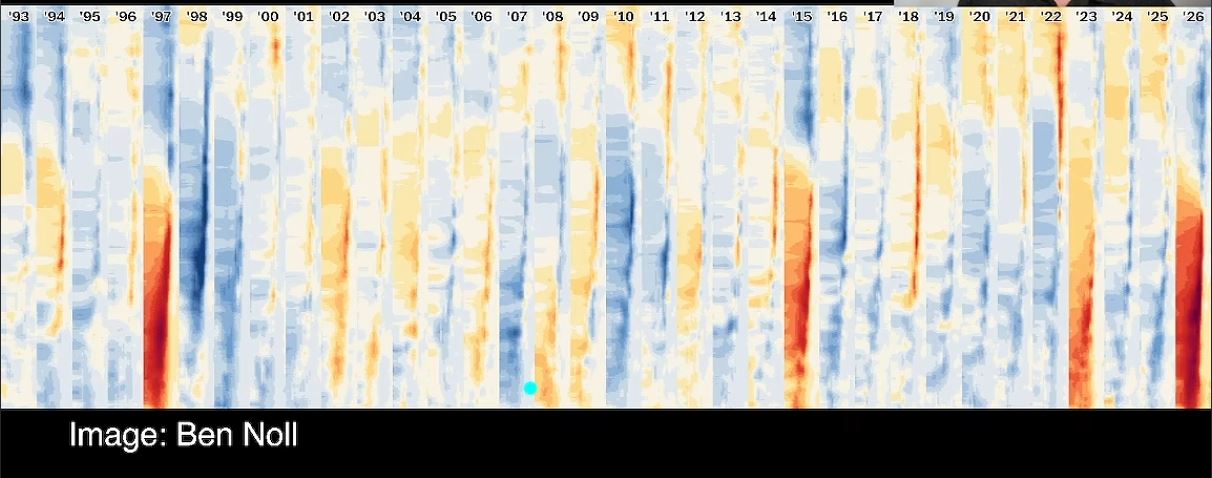
Below are comparisons of eastern pacific sea surface temperature anomaly from the current El Niño event with some of the prior most severe events on record. The top image shows a global view, while the bottom image is a profile of eastern pacific temperature at depth (up to 300 meters deep), showing the similarities between this event and 1997. Needless to say, that’s a lot of red!
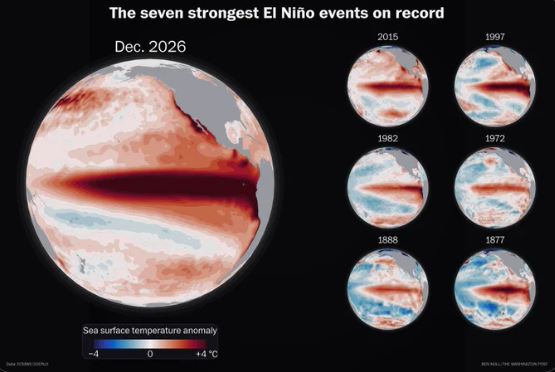
Image: Ben Noll
What does this mean for Precipitation in the West?
Any good meteorologist would tell you (and its an adage I use all the time): all models are wrong, but some are useful. That being said, our ability to forecast general trends at broad scales has improved immensely over the last few decades as more observations are made about impacts of things like El Niño events across large areas. The current takeaway from NOAA’s El Niño monitoring and forecasting is basically as follows: El Niño is here, it is strong, and we think it should lead to warmer than average fall temperatures and either average or slightly above average precipitation across the southern portion of the state. Where that line between average and above average falls is anyone’s guess at the moment, and we look forward to the next forecast which will carry us into projected December/winter precipitation.
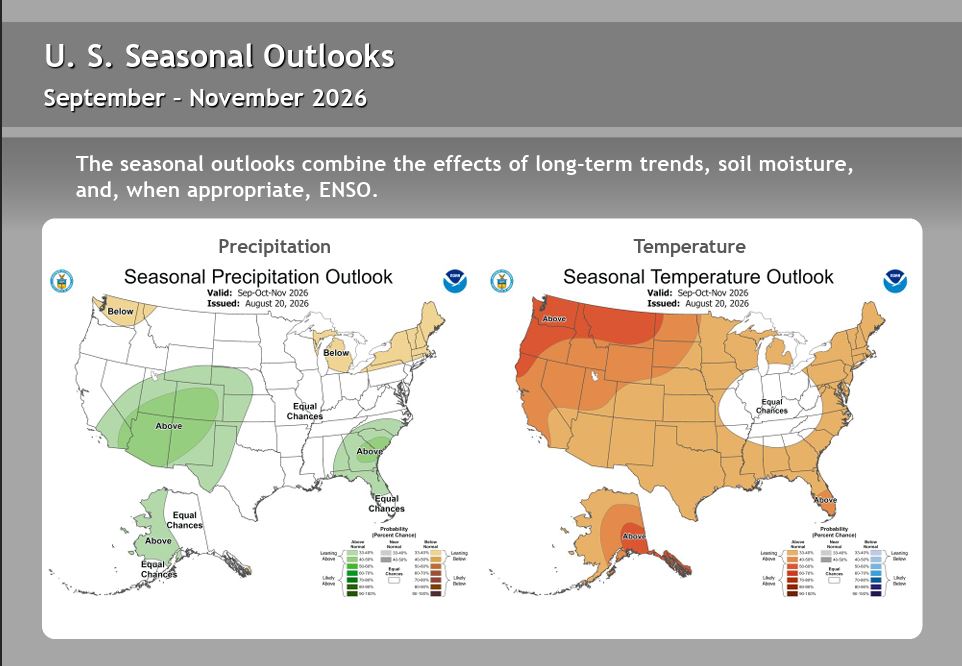
Images/Source: NOAA
But what about more local data and comparing it to past events?
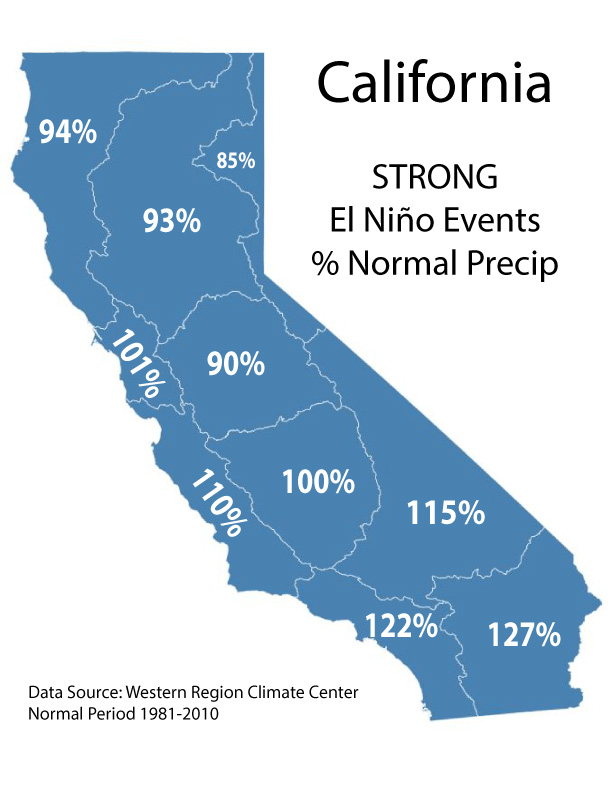
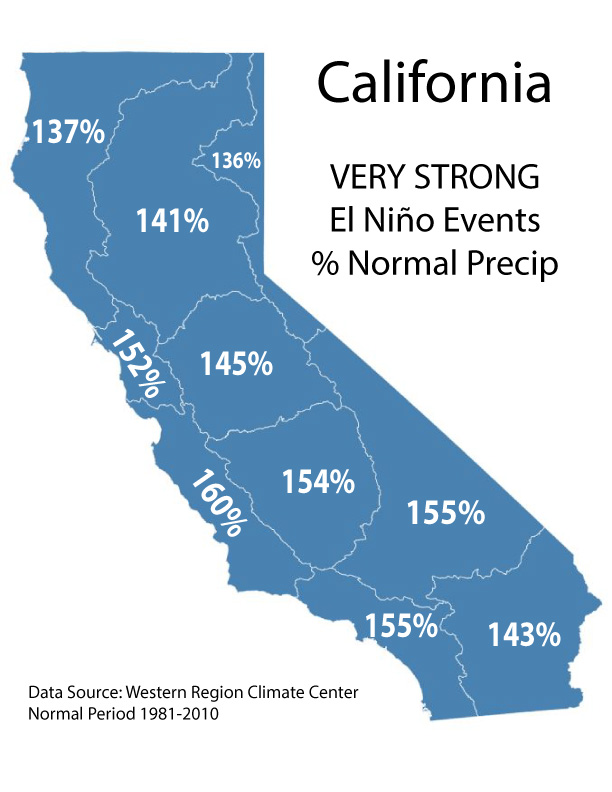
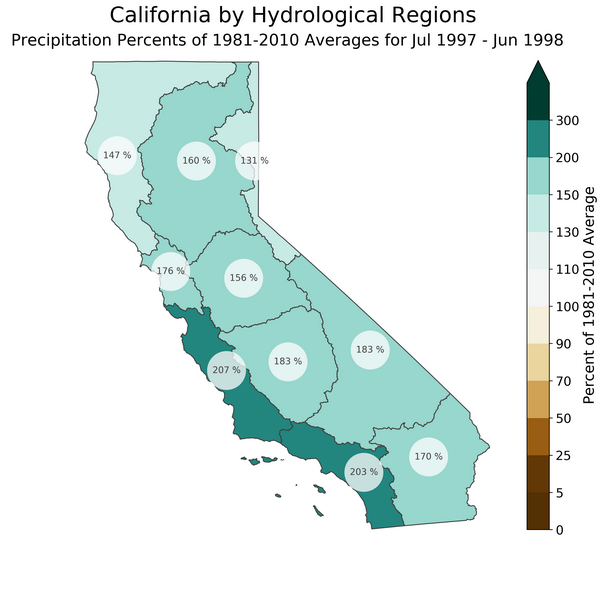
Looking at prior examples of El Niño events in California can sometimes give us a slight idea (although never exactly accurate) of El Niño event impacts by state region. The main takeaway when doing this, however, is that El Niño impacts vary greatly across the state, with the majority of the impacts typically seen in the coastal and southern regions. Strong versus Very Strong events show quite a contract in precipitation between the southern and northern regions of California. Using the 1997/1998 hydrological year, if this year shapes up to be close to that year as is being discussed, may be helpful; in the winter of 97/98, our region of the Northern Sierra saw anywhere from 131%-160% of the 1981-2010 average precipitation.
The biggest caveat here, though, is the type of precipitation. As shown above, El Niño events also typically carry warmer temperatures with them, and the concern is higher precipitation as rain (and lots of it), and less as snow.
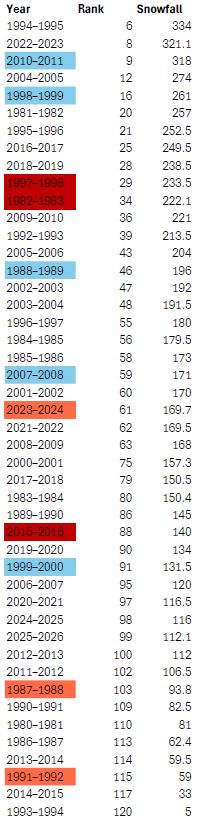
Nowhere is this example of “more precipitation doesn’t always equal more snow” more exemplified than here in our Tahoe region. Many people have tried to forecast snowfall over the years during El Niño or La Niña events, but its not so straightforward. Below is a list of snowfall for each winter period measured in Tahoe City going back to 1980-81, with years highlighted as either El Niño (Light Red for Strong and Dark Red for Very Strong) or La Niña (Blue for strong, no Very Strong on record), along with their rank in the snowfall record. You can see that two recent La Niña years actually had more snowpack than the Very Strong El Niño years that this current year is being compared to, and that in fact that very low snowfall year in 2015-16 was actually a Very Strong El Niño as well. Another BIG caveat here, though, is that this is at lake level, and as discussed above, these storms may just be warmer, so looking at mountain peak, ski resort, or mountain meadow snowpack in these years may tell yet another story!
Either way, more precipitation doesn’t always mean more snow, but either way, we sure could use the moisture out here in the west!








Bob Stefanski says:
Dear Jeff, I love the local stats on the snowfall records from Tahoe. This is exactly what is needed to show the variability in the climate system. Let’s hope more precipitation will arrive this winter!!!
Jeff Lauder says:
Thanks Bob! And thanks for all of the support and data! Yes the amount of geographic variation within an El Nino, what is actually means for type of precip, and where that gradient of impact ends up is always so interesting to see. Would love to hear your thoughts/updates as we see how this plays out, and what it means for drought in the west!
Inge Ivens says:
thanks Jeff – great summary
Taylor Lancelot says:
Thank you for taking the time to break this down for us. Love the line, “all models are wrong but some are useful”. I will be using that.